Stack Overflow 架构(2016年版)
2022-07-22 tech troubleshooting architecture 484 mins 92 图 169423 字

Stack Overflow 这一系列的文章都很好,我挪过来做个备份。原文链接:
一、Stack Overflow: A Technical Deconstruction
One of the reasons I love working at Stack Overflow is we’re allowed encouraged to talk about almost anything out in the open. Except for things companies always keep private like financials and the nuclear launch codes, everything else is fair game. That’s an awesome thing that we haven’t taken advantage of on the technical side lately. I think it’s time for an experiment in extreme openness.
By sharing what we do (and I mean all of us), we better our world. Everyone that works at Stack shares at least one passion: improving life for all developers. Sharing how we do things is one of the best and biggest ways we can do that. It helps you. It helps me. It helps all of us.
When I tell you how we do <something>, a few things happen:
- You might learn something cool you didn’t know about.
- We might learn we’re doing it wrong.
- We’ll both find a better way, together…and we share that too.
- It helps eliminate the perception that “the big boys” always do it right. No, we screw up too.
There’s nothing to lose here and there’s no reason to keep things to yourself unless you’re afraid of being wrong. Good news: that’s not a problem. We get it wrong all the time anyway, so I’m not really worried about that one. Failure is always an option. The best any of us can do is live, learn, move on, and do it better next time.
Here’s where I need your help
I need you to tell me: what do you want to hear about? My intention is to get to a great many things, but it will take some time. What are people most interested in? How do I decide which topic to blog about next? The answer: I don’t know and I can’t decide. That’s where you come in. Please, tell me.
I put together this Trello board: Blog post queue for Stack Overflow topics
I’m also embedding it here for ease, hopefully this adds a lot of concreteness to the adventure:
It’s public. You can comment and vote on topics as well as suggest new topics either on the board itself or shoot me a tweet: @Nick_Craver. Please, help me out by simply voting for what you want to know so I can prioritize the queue. If you see a topic and have specific questions, please comment on the card so I make sure to answer it in the post.
The first post won’t be vote-driven. I think it has to be the architecture overview so all future references make sense. After that, I’ll go down the board and blog the highest-voted topic each time.
I’ve missed blogging due to spending my nights entirely in open source lately. I don’t believe that’s necessarily the best or only way for me to help developers. Having votes for topics gives me real motivation to dedicate the time to writing them up, pulling the stats, and making the pretty pictures. For that, I thank everyone participating.
If you’re curious about my writing style and what to expect, check out some of my previous posts:
- How we upgrade a live data center
- What it takes to run Stack Overflow
- Stackoverflow.com: the road to SSL
Am I crazy? Yep, probably - that’s already a lot of topics. But I think it’ll be fun and engaging. Let’s go on this adventure together.
二、Stack Overflow: The Architecture - 2016 Edition
This is #1 in a very long series of posts on Stack Overflow’s architecture. Welcome. Previous post (#0): Stack Overflow: A Technical Deconstruction Next post (#2): Stack Overflow: The Hardware - 2016 Edition
To get an idea of what all of this stuff “does,” let me start off with an update on the average day at Stack Overflow. So you can compare to the previous numbers from November 2013, here’s a day of statistics from February 9th, 2016 with differences since November 12th, 2013:
- 209,420,973 (+61,336,090) HTTP requests to our load balancer
- 66,294,789 (+30,199,477) of those were page loads
- 1,240,266,346,053 (+406,273,363,426) bytes (1.24 TB) of HTTP traffic sent
- 569,449,470,023 (+282,874,825,991) bytes (569 GB) total received
- 3,084,303,599,266 (+1,958,311,041,954) bytes (3.08 TB) total sent
- 504,816,843 (+170,244,740) SQL Queries (from HTTP requests alone)
- 5,831,683,114 (+5,418,818,063) Redis hits
- 17,158,874 (not tracked in 2013) Elastic searches
- 3,661,134 (+57,716) Tag Engine requests
- 607,073,066 (+48,848,481) ms (168 hours) spent running SQL queries
- 10,396,073 (-88,950,843) ms (2.8 hours) spent on Redis hits
- 147,018,571 (+14,634,512) ms (40.8 hours) spent on Tag Engine requests
- 1,609,944,301 (-1,118,232,744) ms (447 hours) spent processing in ASP.Net
- 22.71 (-5.29) ms average (19.12 ms in ASP.Net) for 49,180,275 question page renders
- 11.80 (-53.2) ms average (8.81 ms in ASP.Net) for 6,370,076 home page renders
You may be wondering about the drastic ASP.Net reduction in processing time compared to 2013 (which was 757 hours) despite 61 million more requests a day. That’s due to both a hardware upgrade in early 2015 as well as a lot of performance tuning inside the applications themselves. Please don’t forget: performance is still a feature. If you’re curious about more hardware specifics than I’m about to provide—fear not. The next post will be an appendix with detailed hardware specs for all of the servers that run the sites (I’ll update this with a link when it’s live).
So what’s changed in the last 2 years? Besides replacing some servers and network gear, not much. Here’s a top-level list of hardware that runs the sites today (noting what’s different since 2013):
- 4 Microsoft SQL Servers (new hardware for 2 of them)
- 11 IIS Web Servers (new hardware)
- 2 Redis Servers (new hardware)
- 3 Tag Engine servers (new hardware for 2 of the 3)
- 3 Elasticsearch servers (same)
- 4 HAProxy Load Balancers (added 2 to support CloudFlare)
- 2 Networks (each a Nexus 5596 Core + 2232TM Fabric Extenders, upgraded to 10Gbps everywhere)
- 2 Fortinet 800C Firewalls (replaced Cisco 5525-X ASAs)
- 2 Cisco ASR-1001 Routers (replaced Cisco 3945 Routers)
- 2 Cisco ASR-1001-x Routers (new!)
What do we need*** to run Stack Overflow? That hasn’t changed much since 2013, but due to the optimizations and new hardware mentioned above, we’re down to **needing* only 1 web server. We have unintentionally tested this, successfully, a few times. To be clear: I’m saying it works. I’m not saying it’s a good idea. It’s fun though, every time.
Now that we have some baseline numbers for an idea of scale, let’s see how we make those fancy web pages. Since few systems exist in complete isolation (and ours is no exception), architecture decisions often make far less sense without a bigger picture of how those pieces fit into the whole. That’s the goal here, to cover the big picture. Many subsequent posts will do deep dives into specific areas. This will be a logistical overview with hardware highlights only; the next post will have the hardware details.
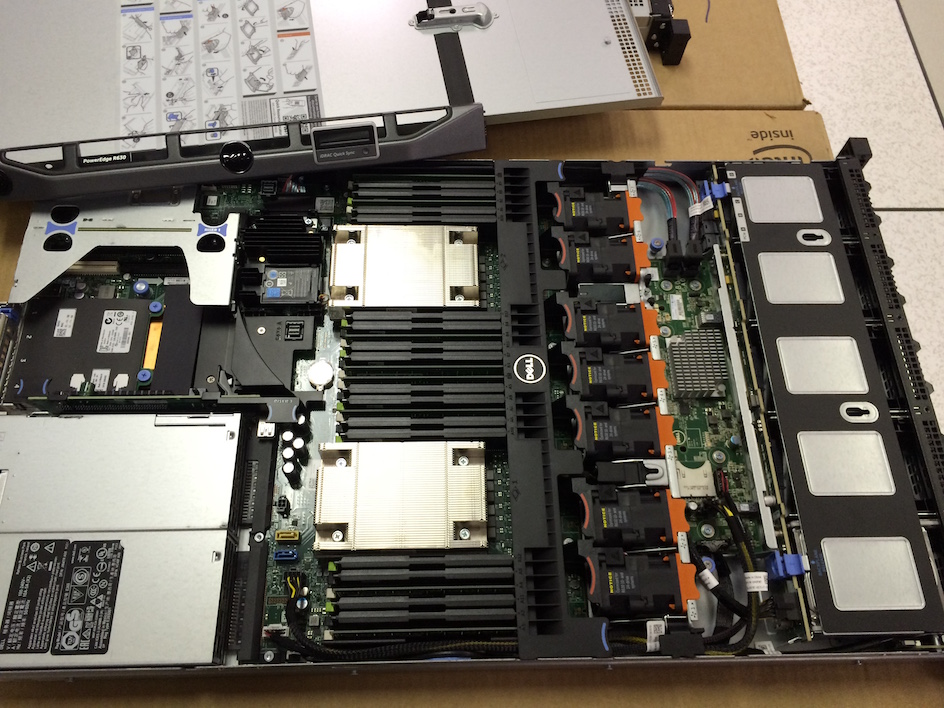
For those of you here to see what the hardware looks like these days, here are a few pictures I took of rack A (it has a matching sister rack B) during our February 2015 upgrade:


…and if you’re into that kind of thing, here’s the entire 256 image album from that week (you’re damn right that number’s intentional). Now, let’s dig into layout. Here’s a logical overview of the major systems in play:

Ground Rules
Here are some rules that apply globally so I don’t have to repeat them with every setup:
- Everything is redundant.
- All servers and network gear have at least 2x 10Gbps connectivity.
- All servers have 2 power feeds via 2 power supplies from 2 UPS units backed by 2 generators and 2 utility feeds.
- All servers have a redundant partner between rack A and B.
- All servers and services are doubly redundant via another data center (Colorado), though I’m mostly talking about New York here.
- Everything is redundant.
The Internets
First, you have to find us—that’s DNS. Finding us needs to be fast, so we farm this out to CloudFlare (currently) because they have DNS servers nearer to almost everyone around the world. We update our DNS records via an API and they do the “hosting” of DNS. But since we’re jerks with deeply-rooted trust issues, we still have our own DNS servers as well. Should the apocalypse happen (probably caused by the GPL, Punyon, or caching) and people still want to program to take their mind off of it, we’ll flip them on.
After you find our secret hideout, HTTP traffic comes from one of our four ISPs (Level 3, Zayo, Cogent, and Lightower in New York) and flows through one of our four edge routers. We peer with our ISPs using BGP (fairly standard) in order to control the flow of traffic and provide several avenues for traffic to reach us most efficiently. These ASR-1001 and ASR-1001-X routers are in 2 pairs, each servicing 2 ISPs in active/active fashion—so we’re redundant here. Though they’re all on the same physical 10Gbps network, external traffic is in separate isolated external VLANs which the load balancers are connected to as well. After flowing through the routers, you’re headed for a load balancer.
I suppose this may be a good time to mention we have a 10Gbps MPLS between our 2 data centers, but it is not directly involved in serving the sites. We use this for data replication and quick recovery in the cases where we need a burst. “But Nick, that’s not redundant!” Well, you’re technically correct (the best kind of correct), that’s a single point of failure on its face. But wait! We maintain 2 more failover OSPF routes (the MPLS is #1, these are #2 and 3 by cost) via our ISPs. Each of the sets mentioned earlier connects to the corresponding set in Colorado, and they load balance traffic between in the failover situation. We could make both sets connect to both sets and have 4 paths but, well, whatever. Moving on.
Load Balancers (HAProxy)
The load balancers are running HAProxy 1.5.15 on CentOS 7, our preferred flavor of Linux. TLS (SSL) traffic is also terminated in HAProxy. We’ll be looking hard at HAProxy 1.7 soon for HTTP/2 support.
Unlike all other servers with a dual 10Gbps LACP network link, each load balancer has 2 pairs of 10Gbps: one for the external network and one for the DMZ. These boxes run 64GB or more of memory to more efficiently handle SSL negotiation. When we can cache more TLS sessions in memory for reuse, there’s less to recompute on subsequent connections to the same client. This means we can resume sessions both faster and cheaper. Given that RAM is pretty cheap dollar-wise, it’s an easy choice.
The load balancers themselves are a pretty simple setup. We listen to different sites on various IPs (mostly for certificate concerns and DNS management) and route to various backends based mostly on the host header. The only things of note we do here is rate limiting and some header captures (sent from our web tier) into the HAProxy syslog message so we can record performance metrics for every single request. We’ll cover that later too.
Web Tier (IIS 8.5, ASP.Net MVC 5.2.3, and .Net 4.6.1)
The load balancers feed traffic to 9 servers we refer to as “primary” (01-09) and 2 “dev/meta” (10-11, our staging environment) web servers. The primary servers run things like Stack Overflow, Careers, and all Stack Exchange sites except meta.stackoverflow.com and meta.stackexchange.com, which run on the last 2 servers. The primary Q&A Application itself is multi-tenant. This means that a single application serves the requests for all Q&A sites. Put another way: we can run the entire Q&A network off of a single application pool on a single server. Other applications like Careers, API v2, Mobile API, etc. are separate. Here’s what the primary and dev tiers look like in IIS:


Here’s what Stack Overflow’s distribution across the web tier looks like in Opserver (our internal monitoring dashboard):

…and here’s what those web servers look like from a utilization perspective:

I’ll go into why we’re so overprovisioned in future posts, but the highlight items are: rolling builds, headroom, and redundancy.
Service Tier (IIS, ASP.Net MVC 5.2.3, .Net 4.6.1, and HTTP.SYS)
Behind those web servers is the very similar “service tier.” It’s also running IIS 8.5 on Windows 2012R2. This tier runs internal services to support the production web tier and other internal systems. The two big players here are “Stack Server” which runs the tag engine and is based on http.sys (not behind IIS) and the Providence API (IIS-based). Fun fact: I have to set affinity on each of these 2 processes to land on separate sockets because Stack Server just steamrolls the L2 and L3 cache when refreshing question lists on a 2-minute interval.
These service boxes do heavy lifting with the tag engine and backend APIs where we need redundancy, but not 9x redundancy. For example, loading all of the posts and their tags that change every n minutes from the database (currently 2) isn’t that cheap. We don’t want to do that load 9 times on the web tier; 3 times is enough and gives us enough safety. We also configure these boxes differently on the hardware side to be better optimized for the different computational load characteristics of the tag engine and elastic indexing jobs (which also run here). The “tag engine” is a relatively complicated topic in itself and will be a dedicated post. The basics are: when you visit /questions/tagged/java, you’re hitting the tag engine to see which questions match. It does all of our tag matching outside of /search, so the new navigation, etc. are all using this service for data.
Cache & Pub/Sub (Redis)
We use Redis for a few things here and it’s rock solid. Despite doing about 160 billion ops a month, every instance is below 2% CPU. Usually much lower:

We have an L1/L2 cache system with Redis. “L1” is HTTP Cache on the web servers or whatever application is in play. “L2” is falling back to Redis and fetching the value out. Our values are stored in the Protobuf format, via protobuf-dot-net by Marc Gravell. For a client, we’re using StackExchange.Redis—written in-house and open source. When one web server gets a cache miss in both L1 and L2, it fetches the value from source (a database query, API call, etc.) and puts the result in both local cache and Redis. The next server wanting the value may miss L1, but would find the value in L2/Redis, saving a database query or API call.
We also run many Q&A sites, so each site has its own L1/L2 caching: by key prefix in L1 and by database ID in L2/Redis. We’ll go deeper on this in a future post.
Alongside the 2 main Redis servers (master/slave) that run all the site instances, we also have a machine learning instance slaved across 2 more dedicated servers (due to memory). This is used for recommending questions on the home page, better matching to jobs, etc. It’s a platform called Providence, covered by Kevin Montrose here.
The main Redis servers have 256GB of RAM (about 90GB in use) and the Providence servers have 384GB of RAM (about 125GB in use).
Redis isn’t just for cache though, it also has a publish & subscriber mechanism where one server can publish a message and all other subscribers receive it—including downstream clients on Redis slaves. We use this mechanism to clear L1 caches on other servers when one web server does a removal for consistency, but there’s another great use: websockets.
Websockets (https://github.com/StackExchange/NetGain)
We use websockets to push real-time updates to users such as notifications in the top bar, vote counts, new nav counts, new answers and comments, and a few other bits.
The socket servers themselves are using raw sockets running on the web tier. It’s a very thin application on top of our open source library: StackExchange.NetGain. During peak, we have about 500,000 concurrent websocket connections open. That’s a lot of browsers. Fun fact: some of those browsers have been open for over 18 months. We’re not sure why. Someone should go check if those developers are still alive. Here’s what this week’s concurrent websocket pattern looks like:

Why websockets? They’re tremendously more efficient than polling at our scale. We can simply push more data with fewer resources this way, while being more instant to the user. They’re not without issues though—ephemeral port and file handle exhaustion on the load balancer are fun issues we’ll cover later.
Search (Elasticsearch)
Spoiler: there’s not a lot to get excited about here. The web tier is doing pretty vanilla searches against Elasticsearch 1.4, using the very slim high-performance StackExchange.Elastic client. Unlike most things, we have no plans to open source this simply because it only exposes a very slim subset of the API we use. I strongly believe releasing it would do more harm than good with developer confusion. We’re using elastic for /search, calculating related questions, and suggestions when asking a question.
Each Elastic cluster (there’s one in each data center) has 3 nodes, and each site has its own index. Careers has an additional few indexes. What makes our setup a little non-standard in the elastic world: our 3 server clusters are a bit beefier than average with all SSD storage, 192GB of RAM, and dual 10Gbps network each.
The same application domains (yeah, we’re screwed with .Net Core here…) in Stack Server that host the tag engine also continually index items in Elasticsearch. We do some simple tricks here such as ROWVERSION in SQL Server (the data source) compared against a “last position” document in Elastic. Since it behaves like a sequence, we can simply grab and index any items that have changed since the last pass.
The main reason we’re on Elasticsearch instead of something like SQL full-text search is scalability and better allocation of money. SQL CPUs are comparatively very expensive, Elastic is cheap and has far more features these days. Why not Solr? We want to search across the entire network (many indexes at once), and this wasn’t supported at decision time. The reason we’re not on 2.x yet is a major change to “types” means we need to reindex everything to upgrade. I just don’t have enough time to make the needed changes and migration plan yet.
Databases (SQL Server)
We’re using SQL Server as our single source of truth. All data in Elastic and Redis comes from SQL Server. We run 2 SQL Server clusters with AlwaysOn Availability Groups. Each of these clusters has 1 master (taking almost all of the load) and 1 replica in New York. Additionally, they have 1 replica in Colorado (our DR data center). All replicas are asynchronous.
The first cluster is a set of Dell R720xd servers, each with 384GB of RAM, 4TB of PCIe SSD space, and 2x 12 cores. It hosts the Stack Overflow, Sites (bad name, I’ll explain later), PRIZM, and Mobile databases.
The second cluster is a set of Dell R730xd servers, each with 768GB of RAM, 6TB of PCIe SSD space, and 2x 8 cores. This cluster runs everything else. That list includes Talent, Open ID, Chat, our Exception log, and every other Q&A site (e.g. Super User, Server Fault, etc.).
CPU utilization on the database tier is something we like to keep very low, but it’s actually a little high at the moment due to some plan cache issues we’re addressing. As of right now, NY-SQL02 and 04 are masters, 01 and 03 are replicas we just restarted today during some SSD upgrades. Here’s what the past 24 hours looks like:

Our usage of SQL is pretty simple. Simple is fast. Though some queries can be crazy, our interaction with SQL itself is fairly vanilla. We have some legacy Linq2Sql, but all new development is using Dapper, our open source Micro-ORM using POCOs. Let me put this another way: Stack Overflow has only 1 stored procedure in the database and I intend to move that last vestige into code.
Libraries
Okay, let’s change gears to something that can more directly help you. I’ve mentioned a few of these up above, but I’ll provide a list here of many open-source .Net libraries we maintain for the world to use. We open sourced them because they have no core business value but can help the world of developers. I hope you find these useful today:
- Dapper (.Net Core) - High-performance Micro-ORM for ADO.Net
- StackExchange.Redis - High-performance Redis client
- MiniProfiler - Lightweight profiler we run on every page (also supports Ruby, Go, and Node)
- Exceptional - Error logger for SQL, JSON, MySQL, etc.
- Jil - High-performance JSON (de)serializer
- Sigil - A .Net CIL generation helper (for when C# isn’t fast enough)
- NetGain - High-performance websocket server
- Opserver - Monitoring dashboard polling most systems directly and feeding from Orion, Bosun, or WMI as well.
- Bosun - Backend monitoring system, written in Go
Next up is a detailed current hardware list of what runs our code. After that, we go down the list. Stay tuned.
三、Stack Overflow: The Hardware - 2016 Edition
This is #2 in a very long series of posts on Stack Overflow’s architecture. Previous post (#1): Stack Overflow: The Architecture - 2016 Edition Next post (#3): Stack Overflow: How We Do Deployment - 2016 Edition
Who loves hardware? Well, I do and this is my blog so I win. If you don’t love hardware then I’d go ahead and close the browser.
Still here? Awesome. Or your browser is crazy slow, in which case you should think about some new hardware.
I’ve repeated many, many times: performance is a feature. Since your code is only as fast as the hardware it runs on, the hardware definitely matters. Just like any other platform, Stack Overflow’s architecture comes in layers. Hardware is the foundation layer for us, and having it in-house affords us many luxuries not available in other scenarios…like running on someone else’s servers. It also comes with direct and indirect costs. But that’s not the point of this post, that comparison will come later. For now, I want to provide a detailed inventory of our infrastructure for reference and comparison purposes. And pictures of servers. Sometimes naked servers. This web page could have loaded much faster, but I couldn’t help myself.
In many posts through this series I will give a lot of numbers and specs. When I say “our SQL server utilization is almost always at 5–10% CPU,” well, that’s great. But, 5–10% of what? That’s when we need a point of reference. This hardware list is meant to both answer those questions and serve as a source for comparison when looking at other platforms and what utilization may look like there, how much capacity to compare to, etc.
How We Do Hardware
Disclaimer: I don’t do this alone. George Beech (@GABeech) is my main partner in crime when speccing hardware here at Stack. We carefully spec out each server for its intended purpose. What we don’t do is order in bulk and assign tasks later. We’re not alone in this process though; you have to know what’s going to run on the hardware to spec it optimally. We’ll work with the developer(s) and/or other site reliability engineers to best accommodate what is intended live on the box.
We’re also looking at what’s best in the system. Each server is not an island. How it fits into the overall architecture is definitely a consideration. What services can share this platform? This data store? This log system? There is inherent value in managing fewer things, or at least fewer variations of anything.
When we spec out our hardware, we look at a myriad of requirements that help determine what to order. I’ve never really written this mental checklist down, so let’s give it a shot:
- Is this a scale up or scale out problem? (Are we buying one bigger machine or a few smaller ones?)
- How much redundancy do we need/want? (How much headroom and failover capability?)
- Storage:
- Will this server/application touch disk? (Do we need anything besides the spinny OS drives?)
- If so, how much? (How much bandwidth? How many small files? Does it need SSDs?)
- If SSDs, what’s the write load? (Are we talking Intel S3500/3700s? P360x? P3700s?)
- How much SSD capacity do we need? (And should it be a 2-tier solution with HDDs as well?)
- Is this data totally transient? (Are SSDs without capacitors, which are far cheaper, a better fit?)
- Will the storage needs likely expand? (Do we get a 1U/10-bay server or a 2U/26-bay server?)
- Is this a data warehouse type scenario? (Are we looking at 3.5” drives? If so, in a 12 or 16 drives per 2U chassis?)
- Is the storage trade-off for the 3.5” backplane worth the 120W TDP limit on processing?
- Do we need to expose the disks directly? (Does the controller need to support pass-through?)
- Will this server/application touch disk? (Do we need anything besides the spinny OS drives?)
- Memory:
- How much memory does it need? (What must we buy?)
- How much memory could it use? (What’s reasonable to buy?)
- Do we think it will need more memory later? (What memory channel configuration should we go with?)
- Is this a memory-access-heavy application? (Do we want to max out the clock speed?)
- Is it highly parallel access? (Do we want to spread the same space across more DIMMs?)
- CPU:
- What kind of processing are we looking at? (Do we need base CPUs or power?)
- Is it heavily parallel? (Do we want fewer, faster cores? Or, does it call for more, slower cores?)
- In what ways? Will there be heavy L2/L3 cache contention? (Do we need a huge L3 cache for performance?)
- Is it mostly single core performance? (Do we want maximum clock?)
- If so, how many processes at once? (Which turbo spread do we want here?)
- Network:
- Do we need additional 10Gb network connectivity? (Is this a “through” machine, such as a load balancer?)
- How much balance do we need on Tx/Rx buffers? (What CPU core count balances best?)
- Redundancy:
- Do we need servers in the DR data center as well?
- Do we need the same number, or is less redundancy acceptable?
- Do we need servers in the DR data center as well?
- Do we need a power cord? No. No we don’t.
Now, let’s see what hardware in our New York QTS data center serves the sites. Secretly, it’s really New Jersey, but let’s just keep that between us. Why do we say it’s the NY data center? Because we don’t want to rename all those NY- servers. I’ll note in the list below when and how Denver differs slightly in specs or redundancy levels.
Hide Pictures (in case you’re using this as a hardware reference list later)
Servers Running Stack Overflow & Stack Exchange Sites
A few global truths so I need not repeat them in each server spec below:
- OS drives are not included unless they’re special. Most servers use a pair of 250 or 500GB SATA HDDs for the OS partition, always in a RAID 1. Boot time is not a concern we have and even if it were, the vast majority of our boot time on any physical server isn’t dependent on drive speed (for example, checking 768GB of memory).
- All servers are connected by 2 or more 10Gb network links in active/active LACP.
- All servers run on 208V single phase power (via 2 PSUs feeding from 2 PDUs backed by 2 sources).
- All servers in New York have cable arms, all servers in Denver do not (local engineer’s preference).
- All servers have both an iDRAC connection (via the management network) and a KVM connection.
Network
- 2x Cisco Nexus 5596UP core switches (96 SFP+ ports each at 10 Gbps)
- 10x Cisco Nexus 2232TM Fabric Extenders (2 per rack - each has 32 BASE-T ports each at 10Gbps + 8 SFP+ 10Gbps uplinks)
- 2x Fortinet 800C Firewalls
- 2x Cisco ASR-1001 Routers
- 2x Cisco ASR-1001-x Routers
- 6x Cisco 2960S-48TS-L Management network switches (1 Per Rack - 48 1Gbps ports + 4 SFP 1Gbps)
- 1x Dell DMPU4032 KVM
- 7x Dell DAV2216 KVM Aggregators (1–2 per rack - each uplinks to the DPMU4032)
Note: Each FEX has 80 Gbps of uplink bandwidth to its core, and the cores have a 160 Gbps port channel between them. Due to being a more recent install, the hardware in our Denver data center is slightly newer. All 4 routers are ASR-1001-x models and the 2 cores are Cisco Nexus 56128P, which have 96 SFP+ 10Gbps ports and 8 QSFP+ 40Gbps ports each. This saves 10Gbps ports for future expansion since we can bond the cores with 4x 40Gbps links, instead of eating 16x 10Gbps ports as we do in New York.
Here’s what the network gear looks like in New York:


…and in Denver:


Give a shout to Mark Henderson, one of our Site Reliability Engineers who made a special trip to the New York DC to get me some high-res, current photos for this post.
SQL Servers (Stack Overflow Cluster)
- 2 Dell R720xd Servers, each with:
- Dual E5-2697v2 Processors (12 cores @2.7–3.5GHz each)
- 384 GB of RAM (24x 16 GB DIMMs)
- 1x Intel P3608 4 TB NVMe PCIe SSD (RAID 0, 2 controllers per card)
- 24x Intel 710 200 GB SATA SSDs (RAID 10)
- Dual 10 Gbps network (Intel X540/I350 NDC)
SQL Servers (Stack Exchange “…and everything else” Cluster)
- 2 Dell R730xd Servers, each with:
- Dual E5-2667v3 Processors (8 cores @3.2–3.6GHz each)
- 768 GB of RAM (24x 32 GB DIMMs)
- 3x Intel P3700 2 TB NVMe PCIe SSD (RAID 0)
- 24x 10K Spinny 1.2 TB SATA HDDs (RAID 10)
- Dual 10 Gbps network (Intel X540/I350 NDC)
Note: Denver SQL hardware is identical in spec, but there is only 1 SQL server for each corresponding pair in New York.
Here’s what the SQL Servers in New York looked like while getting their PCIe SSD upgrades in February:


Web Servers
- 11 Dell R630 Servers, each with:
- Dual E5-2690v3 Processors (12 cores @2.6–3.5GHz each)
- 64 GB of RAM (8x 8 GB DIMMs)
- 2x Intel 320 300GB SATA SSDs (RAID 1)
- Dual 10 Gbps network (Intel X540/I350 NDC)


Service Servers (Workers)
-
2 Dell
R630
Servers, each with:
- Dual E5-2643 v3 Processors (6 cores @3.4–3.7GHz each)
- 64 GB of RAM (8x 8 GB DIMMs)
-
1 Dell
R620
Server, with:
- Dual E5-2667 Processors (6 cores @2.9–3.5GHz each)
- 32 GB of RAM (8x 4 GB DIMMs)
-
2x Intel 320 300GB SATA SSDs (RAID 1)
-
Dual 10 Gbps network (Intel X540/I350 NDC)
Note: NY-SERVICE03 is still an R620, due to not being old enough for replacement at the same time. It will be upgraded later this year.
Redis Servers (Cache)
- 2 Dell R630 Servers, each with:
- Dual E5-2687W v3 Processors (10 cores @3.1–3.5GHz each)
- 256 GB of RAM (16x 16 GB DIMMs)
- 2x Intel 520 240GB SATA SSDs (RAID 1)
- Dual 10 Gbps network (Intel X540/I350 NDC)
Elasticsearch Servers (Search)
- 3 Dell R620 Servers, each with:
- Dual E5-2680 Processors (8 cores @2.7–3.5GHz each)
- 192 GB of RAM (12x 16 GB DIMMs)
- 2x Intel S3500 800GB SATA SSDs (RAID 1)
- Dual 10 Gbps network (Intel X540/I350 NDC)
HAProxy Servers (Load Balancers)
-
2 Dell
R620
Servers (CloudFlare Traffic), each with:
- Dual E5-2637 v2 Processors (4 cores @3.5–3.8GHz each)
- 192 GB of RAM (12x 16 GB DIMMs)
- 6x Seagate Constellation 7200RPM 1TB SATA HDDs (RAID 10) (Logs)
- Dual 10 Gbps network (Intel X540/I350 NDC) - Internal (DMZ) Traffic
- Dual 10 Gbps network (Intel X540) - External Traffic
-
2 Dell
R620
Servers (Direct Traffic), each with:
- Dual E5-2650 Processors (8 cores @2.0–2.8GHz each)
- 64 GB of RAM (4x 16 GB DIMMs)
- 2x Seagate Constellation 7200RPM 1TB SATA HDDs (RAID 10) (Logs)
- Dual 10 Gbps network (Intel X540/I350 NDC) - Internal (DMZ) Traffic
- Dual 10 Gbps network (Intel X540) - External Traffic
Note: These servers were ordered at different times and as a result, differ in spec. Also, the two CloudFlare load balancers have more memory for a memcached install (which we no longer run today) for CloudFlare’s Railgun.
The service, redis, search, and load balancer boxes above are all 1U servers in a stack. Here’s what that stack looks like in New York:


Servers for Other Bits
We have other servers not directly or indirectly involved in serving site traffic. These are either only tangentially related (e.g., domain controllers which are seldom used for application pool authentication and run as VMs) or are for nonessential purposes like monitoring, log storage, backups, etc.
Since this post is meant to be an appendix for many future posts in the series, I’m including all of the interesting “background” servers as well. This also lets me share more server porn with you, and who doesn’t love that?
VM Servers (VMWare, Currently)
-
2 Dell
FX2s
Blade Chassis, each with 2 of 4 blades populated
-
4 Dell
FC630
Blade Servers (2 per chassis), each with:
- Dual E5-2698 v3 Processors (16 cores @2.3–3.6GHz each)
- 768 GB of RAM (24x 32 GB DIMMs)
- 2x 16GB SD Cards (Hypervisor - no local storage)
-
Dual 4x 10 Gbps network (FX IOAs - BASET)
-
-
1 EqualLogic
PS6210X
iSCSI SAN
- 24x Dell 10K RPM 1.2TB SAS HDDs (RAID10)
- Dual 10Gb network (10-BASET)
-
1 EqualLogic
PS6110X
iSCSI SAN
- 24x Dell 10K RPM 900GB SAS HDDs (RAID10)
- Dual 10Gb network (SFP+)


There a few more noteworthy servers behind the scenes that aren’t VMs. These perform background tasks, help us troubleshoot with logging, store tons of data, etc.
Machine Learning Servers (Providence)
These servers are idle about 99% of the time, but do heavy lifting for a nightly processing job: refreshing Providence. They also serve as an inside-the-datacenter place to test new algorithms on large datasets.
- 2 Dell R620 Servers, each with:
- Dual E5-2697 v2 Processors (12 cores @2.7–3.5GHz each)
- 384 GB of RAM (24x 16 GB DIMMs)
- 4x Intel 530 480GB SATA SSDs (RAID 10)
- Dual 10 Gbps network (Intel X540/I350 NDC)
Machine Learning Redis Servers (Still Providence)
This is the redis data store for Providence. The usual setup is one master, one slave, and one instance used for testing the latest version of our ML algorithms. While not used to serve the Q&A sites, this data is used when serving job matches on Careers as well as the sidebar job listings.
- 3 Dell R720xd Servers, each with:
- Dual E5-2650 v2 Processors (8 cores @2.6–3.4GHz each)
- 384 GB of RAM (24x 16 GB DIMMs)
- 4x Samsung 840 Pro 480 GB SATA SSDs (RAID 10)
- Dual 10 Gbps network (Intel X540/I350 NDC)
Logstash Servers (For ya know…logs)
Our Logstash cluster (using Elasticsearch for storage) stores logs from, well, everything. We plan to replicate HTTP logs in here but are hitting performance issues. However, we do aggregate all network device logs, syslogs, and Windows and Linux system logs here so we can get a network overview or search for issues very quickly. This is also used as a data source in Bosun to get additional information when alerts fire. The total cluster’s raw storage is 6x12x4 = 288 TB.
- 6 Dell R720xd Servers, each with:
- Dual E5-2660 v2 Processors (10 cores @2.2–3.0GHz each)
- 192 GB of RAM (12x 16 GB DIMMs)
- 12x 7200 RPM Spinny 4 TB SATA HDDs (RAID 0 x3 - 4 drives per)
- Dual 10 Gbps network (Intel X540/I350 NDC)
HTTP Logging SQL Server
This is where we log every single HTTP hit to our load balancers (sent from HAProxy via syslog) to a SQL database. We only record a few top level bits like URL, Query, UserAgent, timings for SQL, Redis, etc. in here – so it all goes into a Clustered Columnstore Index per day. We use this for troubleshooting user issues, detecting botnets, etc.
- 1 Dell R730xd Server with:
- Dual E5-2660 v3 Processors (10 cores @2.6–3.3GHz each)
- 256 GB of RAM (16x 16 GB DIMMs)
- 2x Intel P3600 2 TB NVMe PCIe SSD (RAID 0)
- 16x Seagate ST6000NM0024 7200RPM Spinny 6 TB SATA HDDs (RAID 10)
- Dual 10 Gbps network (Intel X540/I350 NDC)
Development SQL Server
We like for dev to simulate production as much as possible, so SQL matches as well…or at least it used to. We’ve upgraded production processors since this purchase. We’ll be refreshing this box with a 2U solution at the same time as we upgrade the Stack Overflow cluster later this year.
- 1 Dell R620 Server with:
- Dual E5-2620 Processors (6 cores @2.0–2.5GHz each)
- 384 GB of RAM (24x 16 GB DIMMs)
- 8x Intel S3700 800 GB SATA SSDs (RAID 10)
- Dual 10 Gbps network (Intel X540/I350 NDC)
That’s it for the hardware actually serving the sites or that’s generally interesting. We, of course, have other servers for the background tasks such as logging, monitoring, backups, etc. If you’re especially curious about specs of any other systems, just ask in comments and I’m happy to detail them out. Here’s what the full setup looks like in New York as of a few weeks ago:


What’s next? The way this series works is I blog in order of what the community wants to know about most. Going by the Trello board, it looks like Deployment is the next most interesting topic. So next time expect to learn how code goes from a developers machine to production and everything involved along the way. I’ll cover database migrations, rolling builds, CI infrastructure, how our dev environment is set up, and share stats on all things deployment.
四、Stack Overflow: How We Do Deployment - 2016 Edition
This is #3 in a very long series of posts on Stack Overflow’s architecture. Previous post (#2): Stack Overflow: The Hardware - 2016 Edition
We’ve talked about Stack Overflow’s architecture and the hardware behind it. The next most requested topic was Deployment. How do we get code a developer (or some random stranger) writes into production? Let’s break it down. Keep in mind that we’re talking about deploying Stack Overflow for the example, but most of our projects follow almost an identical pattern to deploy a website or a service.
I’m going ahead and inserting a set of section links here because this post got a bit long with all of the bits that need an explanation:
- Source & Context
- The Human Steps
- Branches
- Git On-Premises
- The Build System
- What’s In The Build?
- Tiers
- Database Migrations
- Localization/Translations (Moonspeak)
- Building Without Breaking
- Extra resources because I love you all
Source
This is our starting point for this article. We have the Stack Overflow repository on a developer’s machine. For the sake of discussing the process, let’s say they added a column to a database table and the corresponding property to the C# object — that way we can dig into how database migrations work along the way.
A Little Context
We deploy roughly 25 times per day to development (our CI build) just for Stack Overflow Q&A. Other projects also push many times. We deploy to production about 5-10 times on a typical day. A deploy from first push to full deploy is under 9 minutes (2:15 for dev, 2:40 for meta, and 3:20 for all sites). We have roughly 15 people pushing to the repository used in this post. The repo contains the code for these applications: Stack Overflow (every single Q&A site), stackexchange.com (root domain only), Stack Snippets (for Stack Overflow JavaScript snippets), Stack Auth (for OAuth), sstatic.net (cookieless CDN domain), Stack Exchange API v2, Stack Exchange Mobile (iOS and Android API), Stack Server (Tag Engine and Elasticsearch indexing Windows service), and Socket Server (our WebSocket Windows service).
The Human Steps
When we’re coding, if a database migration is involved then we have some extra steps. First, we check the chatroom (and confirm in the local repo) which SQL migration number is available next (we’ll get to how this works). Each project with a database has their own migration folder and number. For this deploy, we’re talking about the Q&A migrations folder, which applies to all Q&A databases. Here’s what chat and the local repo look like before we get started:

And here’s the local %Repo%\StackOverflow.Migrations\ folder: 
You can see both in chat and locally that 726 was the last migration number taken. So we’ll issue a “taking 727 - Putting JSON in SQL to see who it offends” message in chat. This will claim the next migration so that we don’t collide with someone else also doing a migration. We just type a chat message, a bot pins it. Fun fact: it also pins when I say “taking web 2 offline”, but we think it’s funny and refuse to fix it. Here’s our little Pinbot trolling:

Now let’s add some code — we’ll keep it simple here:
A \StackOverflow\Models\User.cs diff:
+ public string PreferencesJson { get; set; }
And our new \StackOverflow.Migrations\727 - Putting JSON in SQL to see who it offends.sql:
If dbo.fnColumnExists('Users', 'PreferencesJson') = 0
Begin
    Alter Table Users Add PreferencesJson nvarchar(max);
End
We’ve tested the migration works by running it against our local Q&A database of choice in SSMS and that the code on top of it works. Before deploying though, we need to make sure it runs as a migration. For example, sometimes you may forget to put a GO separating something that must be the first or only operation in a batch such as creating a view. So, we test it in the runner. To do this, we run the migrate.local.bat you see in the screenshot above. The contents are simple:
..\Build\Migrator-Fast --tier=local
  --sites="Data Source=.;Initial Catalog=Sites.Database;Integrated Security=True" %*
PAUSE
Note: the migrator is a project, but we simply drop the .exe in the solutions using it, since that’s the simplest and most portable thing that works.
What does this migrator do? It hits our local copy of the Sites database. It contains a list of all the Q&A sites that developer runs locally and the migrator uses that list to connect and run all migrations against all databases, in Parallel. Here’s what a run looks like on a simple install with a single Q&A database:

So far, so good. We have code and a migration that works and code that does…some stuff (which isn’t relevant to this process). Now it’s time to take our little code baby and send it out into the world. It’s time to fly little code, be freeeeee! Okay now that we’re excited, the typical process is:
git add <files> (usually --all for small commits)
git commit -m "Migration 727: Putting JSON in SQL to see who it offends"
git pull --rebase
git push
Note: we first check our team chatroom to see if anyone is in the middle of a deploy. Since our deployments are pretty quick, the chances of this aren’t that big. But, given how often we deploy, collisions can and do happen. Then we yell at the designer responsible.
With respect to the Git commands above: if a command line works for you, use it. If a GUI works for you, use it. Use the best tooling for you and don’t give a damn what anyone else thinks. The entire point of tooling from an ancient hammer to a modern Git install is to save time and effort of the user. Use whatever saves you the most time and effort. Unless it’s Emacs, then consult a doctor immediately.
Branches
I didn’t cover branches above because compared to many teams, we very rarely use them. Most commits are on master. Generally, we branch for only one of a few reasons:
- A developer is new, and early on we want code reviews
- A developer is working on a big (or risky) feature and wants a one-off code review
- Several developers are working on a big feature
Other than the (generally rare) cases above, almost all commits are directly to master and deployed soon after. We don’t like a big build queue. This encourages us to make small to medium size commits often and deploy often. It’s just how we choose to operate. I’m not recommending it for most teams or any teams for that matter. Do what works for you. This is simply what works for us.
When we do branch, merging back in is always a topic people are interested in. In the vast majority of cases, we’ll squash when merging into master so that rolling back the changes is straightforward. We also keep the original branch around a few days (for anything major) to ensure we don’t need to reference what that specific change was about. That being said, we’re practical. If a squash presents a ton of developer time investment, then we just eat the merge history and go on with our lives.
Git On-Premises
Alright, so our code is sent to the server-side repo. Which repo? We’re currently using Gitlab for repositories. It’s pretty much GitHub, hosted on-prem. If Gitlab pricing keeps getting crazier (note: I said “crazier”, not “more expensive”), we’ll certainly re-evaluate GitHub Enterprise again.
Why on-prem for Git hosting? For the sake of argument, let’s say we used GitHub instead (we did evaluate this option). What’s the difference? First, builds are slower. While GitHub’s protocol implementation of Git is much faster, latency and bandwidth making the builds slower than pulling over 2x10Gb locally. But to be fair, GitHub is far faster than Gitlab at most operations (especially search and viewing large diffs).
However, depending on GitHub (or any offsite third party) has a few critical downsides for us. The main downside is the dependency chain. We aren’t just relying on GitHub servers to be online (their uptime is pretty good). We’re relying on them to be online and being able to get to them. For that matter, we’re also relying on all of our remote developers to be able to push code in the first place. That’s a lot of switching, routing, fiber, and DDoS surface area in-between us and the bare essentials needed to build: code. We can drastically shorten that dependency chain by being on a local server. It also alleviates most security concerns we have with any sensitive code being on a third-party server. We have no inside knowledge of any GitHub security issues or anything like that, we’re just extra careful with such things. Quite simply: if something doesn’t need to leave your network, the best security involves it not leaving your network.
All of that being said, our open source projects are hosted on GitHub and it works great. The critical ones are also mirrored internally on Gitlab for the same reasons as above. We have no issues with GitHub (they’re awesome), only the dependency chain. For those unaware, even this website is running on GitHub pages…so if you see a typo in this post, submit a PR.
The Build System
Once the code is in the repo, the continuous integration build takes over. This is just a fancy term for a build kicked off by a commit. For builds, we use TeamCity. The TeamCity server is actually on the same VM as Gitlab since neither is useful without the other and it makes TeamCity’s polling for changes a fast and cheap operation. Fun fact: since Linux has no built-in DNS caching, most of the DNS queries are looking for…itself. Oh wait, that’s not a fun fact — it’s actually a pain in the ass.
As you may have heard, we like to keep things really simple. We have extra compute capacity on our web tier, so…we use it. Builds for all of the websites run on agents right on the web tier itself, this means we have 11 build agents local to each data center. There are a few additional Windows and Linux build agents (for puppet, rpms, and internal applications) on other VMs, but they’re not relevant to this deploy process.
Like most CI builds, we simply poll the Git repo on an interval to see if there are changes. This repo is heavy hit, so we poll for changes every 15 seconds. We don’t like waiting. Waiting sucks. Once a change is detected, the build server instructs an agent to run a build.
Since our repos are large (we include dependencies like NuGet packages, though this is changing), we use what TeamCity calls agent-side checkout. This means the agent does the actual fetching of content directly from the repository, rather than the default of the web server doing the checkout and sending all of the source to the agent. On top of this, we’re using Git mirrors. Mirrors maintain a full repository (one per repo) on the agent. This means the very first time the agent builds a given repository, it’s a full git clone. However, every time after that it’s just a git pull. Without this optimization, we’re talking about a git clone --depth 1, which grabs the current file state and no history — just what we need for a build. With the very small delta we’ve pushed above (like most commits) a git pull of only that delta will always beat the pants off grabbing all of files across the network. That first-build cost is a no-brainer tradeoff.
As I said earlier, there are many projects in this repo (all connected), so we’re really talking about several builds running each commit (5 total):

What’s In The Build?
Okay…what’s that build actually doing? Let’s take a top level look and break it down. Here are the 9 build steps in our development/CI build:

And here’s what the log of the build we triggered above looks like (you can see the full version in a gist here):

Steps 1 & 2: Migrations
The first 2 steps are migrations. In development, we automatically migrate the “Sites” database. This database is our central store that contains the master list of sites and other network-level items like the inbox. This same migration isn’t automatic in production since “should this run be before or after code is deployed?” is a 50/50 question. The second step is what we ran locally, just against dev. In dev, it’s acceptable to be down for a second, but that still shouldn’t happen. In the Meta build, we migrate all production databases. This means Stack Overflow’s database gets new SQL bits minutes before code. We order deploys appropriately.
The important part here is databases are always migrated before code is deployed. Database migrations are a topic all in themselves and something people have expressed interest in, so I detail them a bit more a little later in this post.
Step 3: Finding Moonspeak (Translation)
Due to the structure and limitations of the build process, we have to locate our Moonspeak tooling since we don’t know the location for sure (it changes with each version due to the version being in the path). Okay, what’s Moonspeak? Moonspeak is the codename for our localization tooling. Don’t worry, we’ll cover it in-depth later. The step itself is simple:
echo "##teamcity[setParameter name='system.moonspeaktools'
  value='$((get-childitem -directory packages/StackExchange.MoonSpeak.2*).FullName)\tools']"
It’s just grabbing a directory path and setting the system.moonspeaktools TeamCity variable to the result. If you’re curious about all of the various ways to interact with TeamCity’s build, there’s an article here.
Step 4: Translation Dump (JavaScript Edition)
In dev specifically, we run the dump of all of our need-to-be-translated strings in JavaScript for localization. Again the command is pretty simple:
%system.moonspeaktools%\Jerome.exe extract
  %system.translationsDumpPath%\artifact-%build.number%-js.{0}.txt en;pt-br;mn-mn;ja;es;ru
  ".\StackOverflow\Content\Js\*.js;.\StackOverflow\Content\Js\PartialJS\**\*.js"
Phew, that was easy. I don’t know why everyone hates localization. Just kidding, localization sucks here too. Now I don’t want to dive too far into localization because that’s a whole (very long) post on its own, but here are the translation basics:
Strings are surrounded by _s() (regular string) or _m() (markdown) in code. We love _s() and _m(). It’s almost identical for both JavaScript and C#. During the build, we extract these strings by analyzing the JavaScript (with AjaxMin) and C#/Razor (with a custom Roslyn-based build). We take these strings and stick them in files to use for the translators, our community team, and ultimately back into the build later. There’s obviously way more going on - but those are the relevant bits. It’s worth noting here that we’re excited about the proposed Source Generators feature specced for a future Roslyn release. We hope in its final form we’ll be able to re-write this portion of Moonspeak as a much simpler generator while still avoiding as many runtime allocations as possible.
Step 5: MSBuild
This is where most of the magic happens. It’s a single step, but behind the scenes, we’re doing unspeakable things to MSBuild that I’m going to…speak about, I guess. The full .msbuild file is in the earlier Gist. The most relevant section is the description of crazy:
THIS IS HOW WE ROLL:
CompileWeb - ReplaceConfigs - - - - - - BuildViews - - - - - - - - - - - - - PrepareStaticContent
                   \                                                            /|
                    '- BundleJavaScript - TranslateJsContent - CompileNode   - '
NOTE:
since msbuild requires separate projects for parallel execution of targets, this build file is copied
2 times, the DefaultTargets of each copy is set to one of BuildViews, CompileNode or CompressJSContent.
thus the absence of the DependesOnTarget="ReplaceConfigs" on those _call_ targets
While we maintain 1 copy of the file in the repo, during the build it actually forks into 2 parallel MSBuild processes. We simply copy the file, change the DefaultTargets, and kick it off in parallel here.
The first process is building the ASP.NET MVC views with our custom Roslyn-based build in StackExchange.Precompilation, explained by Samo Prelog here. It’s not only building the views but also plugging in localized strings for each language via switch statements. There’s a hint at how that works a bit further down. We wrote this process for localization, but it turns out controlling the speed and batching of the view builds allows us to be much faster than aspnet_compiler used to be. Rumor is performance has gotten better there lately, though.
The second process is the .less, .css, and .js compilation and minification which involves a few components. First up are the .jsbundle files. They are simple files that look like this example:
{
  "items": [ "full-anon.jsbundle", "PartialJS\\full\\*.js", "bounty.js" ]
}
These files are true to their name, they are simply concatenated bundles of files for use further on. This allows us to maintain JavaScript divided up nicely across many files but handle it as one file for the rest of the build. The same bundler code runs as an HTTP handler locally to combine on the fly for local development. This sharing allows us to mimic production as best we can.
After bundling, we have regular old .js files with JavaScript in them. They have letters, numbers, and even some semicolons. They’re delightful. After that, they go through the translator of doom. We think. No one really knows. It’s black magic. Really what happens here isn’t relevant, but we get a full.en.js, full.ru.js, full.pt.js, etc. with the appropriate translations plugged in. It’s the same <filename>.<locale>.js pattern for every file. I’ll do a deep-dive with Samo on the localization post (go vote it up if you’re curious).
After JavaScript translation completes (10-12 seconds), we move on to the Node.js piece of the build. Note: node is not installed on the build servers; we have everything needed inside the repo. Why do we use Node.js? Because it’s the native platform for Less.js and UglifyJS. Once upon a time we used dotLess, but we got tired of maintaining the fork and went with a node build process for faster absorption of new versions.
The node-compile.js is also in the Gist. It’s a simple forking script that sets up n node worker processes to handle the hundreds of files we have (due to having hundreds of sites) with the main thread dishing out work. Files that are identical (e.g. the beta sites) are calculated once then cached, so we don’t do the same work a hundred times. It also does things like add cache breakers on our SVG URLs based on a hash of their contents. Since we also serve the CSS with a cache breaker at the application level, we have a cache-breaker that changes from bottom to top, properly cache-breaking at the client when anything changes. The script can probably be vastly improved (and I’d welcome it), it was just the simplest thing that worked and met our requirements when it was written and hasn’t needed to change much since.
Note: a (totally unintentional) benefit of the cache-breaker calculation has been that we never deploy an incorrect image path in CSS. That situation blows up because we can’t find the file to calculate the hash…and the build fails.
The totality of node-compile’s job is minifying the .js files (in place, not something like .min.js) and turning .less into .css. After that’s done, MSBuild has produced all the output we need to run a fancy schmancy website. Or at least something like Stack Overflow. Note that we’re slightly odd in that we share styles across many site themes, so we’re transforming hundreds of .less files at once. That’s the reason for spawning workers — the number spawned scales based on core count.
Step 6: Translation Dump (C# Edition)
This step we call the transmogulator. It copies all of the to-be-localized strings we use in C# and Razor inside _s() and _m() out so we have the total set to send to the translators. This isn’t a direct extraction, it’s a collection of some custom attributes added when we translated things during compilation in the previous step. This step is just a slightly more complicated version of what’s happening in step #4 for JavaScript. We dump the files in raw .txt files for use later (and as a history of sorts). We also dump the overrides here, where we supply overrides directly on top of what our translators have translated. These are typically community fixes we want to upstream.
I realize a lot of that doesn’t make a ton of sense without going heavily into how the translation system works - which will be a topic for a future post. The basics are: we’re dumping all the strings from our codebase so that people can translate them. When they are translated, they’ll be available for step #5 above in the next build after.
Here’s the entire step:
%system.moonspeaktools%\Transmogulator.exe .\StackOverflow\bin en;pt-br;mn-mn;ja;es;ru
  "%system.translationsDumpPath%\artifact-%build.number%.{0}.txt" MoonSpeak
%system.moonspeaktools%\OverrideExporter.exe export "%system.translationConnectionString%"
  "%system.translationsDumpPath%"
Step 7: Importing English Strings
One of the weird things to think about in localization is the simplest way to translate is to not special case English. To that end, here we are special casing it. Dammit, we already screwed up. But, by special casing it at build time, we prevent having to special case it later. Almost every string we put in would be correct in English, only needing the translation overrides for multiples and such (e.g. “1 item” vs “2 items”), so we want to immediately import anything added to the English result set so that it’s ready for Stack Overflow as soon as it’s built the first time (e.g. no delay on the translators for deploying a new feature). Ultimately, this step takes the text files created for English in Steps 4 and 6 and turns around and inserts them (into our translations database) for the English entries.
This step also posts all new strings added to a special internal chatroom alerting our translators in all languages so that they can be translated ASAP. Though we don’t want to delay builds and deploys on new strings (they may appear in English for a build and we’re okay with that), we want to minimize it - so we have an alert pipe so to speak. Localization delays are binary: either you wait on all languages or you don’t. We choose faster deploys.
Here’s the call for step 7:
%system.moonspeaktools%\MoonSpeak.Importer.exe "%system.translationConnectionString%"
  "%system.translationsDumpPath%\artifact-%build.number%.en.txt" 9 false
  "https://teamcity/viewLog.html?buildId=%teamcity.build.id%&tab=buildChangesDiv"
%system.moonspeaktools%\MoonSpeak.Importer.exe "%system.translationConnectionString%"
  "%system.translationsDumpPath%\artifact-%build.number%-js.en.txt" 9 false
  "https://teamcity/viewLog.html?buildId=%teamcity.build.id%&tab=buildChangesDiv"
Step 8: Deploy Website
Here’s where all of our hard work pays off. Well, the build server’s hard work really…but we’re taking credit. We have one goal here: take our built code and turn it into the active code on all target web servers. This is where you can get really complicated when you really just need to do something simple. What do you really need to perform to deploy updated code to a web server? Three things:
- Stop the website
- Overwrite the files
- Start the website
That’s it. That’s all the major pieces. So let’s get as close to the stupidest, simplest process as we can. Here’s the call for that step, it’s a PowerShell script we pre-deploy on all build agents (with a build) that very rarely changes. We use the same set of scripts for all IIS website deployments, even the Jekyll-based blog. Here are the arguments we pass to the WebsiteDeploy.ps1 script:
-HAProxyServers "%deploy.HAProxy.Servers%"
-HAProxyPort %deploy.HAProxy.Port%
-Servers "%deploy.ServerNames%"
-Backends "%deploy.HAProxy.Backends%"
-Site "%deploy.WebsiteName%"
-Delay %deploy.HAProxy.Delay.IIS%
-DelayBetween %deploy.HAProxy.Delay.BetweenServers%
-WorkingDir "%teamcity.build.workingDir%\%deploy.WebsiteDirectory%"
-ExcludeFolders "%deploy.RoboCopy.ExcludedFolders%"
-ExcludeFiles "%deploy.RoboCopy.ExcludedFiles%"
-ContentSource "%teamcity.build.workingDir%\%deploy.contentSource%"
-ContentSStaticFolder "%deploy.contentSStaticFolder%"
I’ve included script in the Gist here, with all the relevant functions from the profile included for completeness. The meat of the main script is here (lines shortened for fit below, but the complete version is in the Gist):
$ServerSession = Get-ServerSession $s
if ($ServerSession -ne $null)
{
    Execute "Server: $s" {
        HAProxyPost -Server $s -Action "drain"
        # delay between taking a server out and killing the site, so current requests can finish
        Delay -Delay $Delay
        # kill website in IIS
        ToggleSite -ServerSession $ServerSession -Action "stop" -Site $Site
        # inform HAProxy this server is down, so we don't come back up immediately
        HAProxyPost -Server $s -Action "hdown"
        # robocopy!
        CopyDirectory -Server $s -Source $WorkingDir -Destination "\\$s\..."
        # restart website in IIS
        ToggleSite -ServerSession $ServerSession -Action "start" -Site $Site
        # stick the site back in HAProxy rotation
        HAProxyPost -Server $s -Action "ready"
        # session cleanup
        $ServerSession | Remove-PSSession
    }
}
The steps here are the minimal needed to gracefully update a website, informing the load balancer of what’s happening and impacting users as little as possible. Here’s what happens:
- Tell HAProxy to stop sending new traffic
- Wait a few seconds for all current requests to finish
- Tell IIS to stop the site (
Stop-Website) - Tell HAProxy that this webserver is down (rather than waiting for it to detect)
- Copy the new code (
robocopy) - Tell IIS to start the new site (
Start-Website) - Tell HAProxy this website is ready to come back up
Note that HAProxy doesn’t immediately bring the site back online. It will do so after 3 successful polls, this is a key difference between MAINT and DRAIN in HAProxy. MAINT -> READY assumes the server is instantly up. DRAIN -> READY assumes down. The former has a very nasty effect on ThreadPool growth waiting with the initial slam while things are spinning up.
We repeat the above for all webservers in the build. There’s also a slight pause between each server, all of which is tunable with TeamCity settings.
Now the above is what happens for a single website. In reality, this step deploys twice. The reason why is race conditions. For the best client-side performance, our static assets have headers set to cache for 7 days. We break this cache only when it changes, not on every build. After all, you only need to fetch new CSS, SVGs, or JavaScript if they actually changed. Since cdn.sstatic.net comes from our web tier underneath, here’s what could happen due to the nature of a rolling build:
You hit ny-web01 and get a brand spanking new querystring for the new version. Your browser then hits our CDN at cdn.sstatic.net, which let’s say hits ny-web07…which has the old content. Oh crap, now we have old content cached with the new hash for a hell of a long time. That’s no good, that’s a hard reload to fix, after you purge the CDN. We avoid that by pre-deploying the static assets to another website in IIS specifically serving the CDN. This way sstatic.net gets the content in one rolling deploy, just before the new code issuing new hashes goes out. This means that there is a slight chance that someone will get new static content with an old hash (if they hit a CDN miss for a piece of content that actually changed this build). The big difference is that (rarely hit) problem fixes itself on a page reload, since the hash will change as soon as the new code is running a minute later. It’s a much better direction to fail in.
At the end of this step (in production), 7 of 9 web servers are typically online and serving users. The last 2 will finish their spin-up shortly after. The step takes about 2 minutes for 9 servers. But yay, our code is live! Now we’re free to deploy again for that bug we probably just sent out.
Step 9: New Strings Hook
This dev-only step isn’t particularly interesting, but useful. All it does is call a webhook telling it that some new strings were present in this build if there were any. The hook target triggers an upload to our translation service to tighten the iteration time on translations (similar to our chat mechanism above). It’s last because strictly speaking it’s optional and we don’t want it to interfere.
That’s it. Dev build complete. Put away the rolly chairs and swords.
Tiers
What we covered above was the entire development CI build with all the things™. All of the translation bits are development only because we just need to get the strings once. The meta and production builds are a simpler subset of the steps. Here’s a simple visualization that compares the build steps across tiers:
| Build Step | Dev | Meta | Prod |
|---|---|---|---|
| 1 - Migrate Sites DB | |||
| 2 - Migrate Q&A DBs | |||
| 3 - Find MoonSpeak Tools | |||
| 4 - Translation Dump (JavaScript) | |||
| 5 - MSBuild (Compile Compress and Minify) | |||
| 6 - Translation Dump (C#) | |||
| 7 - Translations Import English Strings | |||
| 8 - Deploy Website | |||
| 9 - New Strings Hook |
What do the tiers really translate to? All of our development sites are on WEB10 and WEB11 servers (under different application pools and websites). Meta runs on WEB10 and WEB11 servers, this is specifically meta.stackexchange.com and meta.stackoverflow.com. Production (all other Q&A sites and metas) like Stack Overflow are on WEB01-WEB09.
Note: we do a chat notification for build as someone goes through the tiers. Here’s me (against all sane judgement) building out some changes at 5:17pm on a Friday. Don’t try this at home, I’m a professional. Sometimes. Not often.

Database Migrations
See? I promised we’d come back to these. To reiterate: if new code is needed to handle the database migrations, it must be deployed first. In practice though, you’re likely dropping a table, or adding a table/column. For the removal case, we remove it from code, deploy, then deploy again (or later) with the drop migration. For the addition case, we would typically add it as nullable or unused in code. If it needs to be not null, a foreign key, etc. we’d do that in a later deploy as well.
The database migrator we use is a very simple repo we could open source, but honestly, there are dozens out there and the “same migration against n databases” is fairly specific. The others are probably much better and ours is very specific to only our needs. The migrator connects to the Sites database, gets the list of databases to run against, and executes all migrations against every one (running multiple databases in parallel). This is done by looking at the passed-in migrations folder and loading it (once) as well as hashing the contents of every file. Each database has a Migrations table that keeps track of what has already been run. It looks like this (descending order):

Note that the above aren’t all in file number order. That’s because 724 and 725 were in a branch for a few days. That’s not an issue, order is not guaranteed. Each migration itself is written to be idempotent, e.g. “don’t try to add the column if it’s already there”, but the specific order isn’t usually relevant. Either they’re all per-feature, or they’re actually going in-order anyway. The migrator respects the GO operator to separate batches and by default runs all migrations in a transaction. The transaction behavior can be changed with a first-line comment in the .sql file: -- no transaction --. Perhaps the most useful explanation to the migrator is the README.md I wrote for it. Here it is in the Gist.
In memory, we compare the list of migrations that already ran to those needing to run then execute what needs running, in file order. If we find the hash of a filename doesn’t match the migration with the same file name in the table, we abort as a safety measure. We can --force to resolve this in the rare cases a migration should have changed (almost always due to developer error). After all migrations have run, we’re done.
Rollbacks. We rarely do them. In fact, I can’t remember ever having done one. We avoid them through the approach in general: we deploy small and often. It’s often quicker to fix code and deploy than reverse a migration, especially across hundreds of databases. We also make development mimic production as often as possible, restoring production data periodically. If we needed to reverse something, we could just push another migration negating whatever we did that went boom. The tooling has no concept of rollback though. Why roll back when you can roll forward?
Localization/Translations (Moonspeak)
This will get its own post, but I wanted to hint at why we do all of this work at compile time. After all, I always advocate strongly for simplicity (yep, even in this 6,000-word blog post - the irony is not lost on me). You should only do something more complicated when you need to do something more complicated. This is one of those cases, for performance. Samo does a lot of work to make our localizations have as little runtime impact as possible. We’ll gladly trade a bit of build complexity to make that happen. While there are options such as .resx files or the new localization in ASP.NET Core 1.0, most of these allocate more than necessary especially with tokenized strings. Here’s what strings look like in our code:

And here’s what that line looks like compiled (via Reflector):  …and most importantly, the compiled implementation:
Note that we aren’t allocating the entire string together, only the pieces (with most interned). This may seem like a small thing, but at scale that’s a huge number of allocations and a lot of time in a garbage collector. I’m sure that just raises a ton of questions about how Moonspeak works. If so, go vote it up. It’s a big topic in itself, I only wanted to justify the compile-time complication it adds here. To us, it’s worth it.
Building Without Breaking
A question I’m often asked is how we prevent breaks while rolling out new code constantly. Here are some common things we run into and how we avoid them.
- Cache object changes:
- If we have a cache object that totally changes. That’s a new cache key and we let the old one fall out naturally with time.
- If we have a cache object that only changes locally (in-memory): nothing to do. The new app domain doesn’t collide.
- If we have a cache object that changes in redis, then we need to make sure the old and new protobuf signatures are compatible…or change the key.
- Tag Engine:
- The tag engine reloads on every build (currently). This is triggered by checking every minute for a new build hash on the web tier. If one is found, the application
\binand a few configs are downloaded to the Stack Server host process and spun up as a new app domain. This sidesteps the need for a deploy to those boxes and keeps local development setup simple (we run no separate process locally). - This one is changing drastically soon, since reloading every build is way more often that necessary. We’ll be moving to a more traditional deploy-it-when-it-changes model there soon. Possibly using GPUs. Stay tuned.
- The tag engine reloads on every build (currently). This is triggered by checking every minute for a new build hash on the web tier. If one is found, the application
- Renaming SQL objects:
- “Doctor it hurts when I do that!”
- “Don’t do that.”
- We may add and migrate, but a live rename is almost certain to cause an outage of some sort. We don’t do that outside of dev.
- APIs:
- Deploy the new endpoint before the new consumer.
- If changing an existing endpoint, it’s usually across 3 deploys: add (endpoint), migrate (consumer), cleanup (endpoint).
- Bugs:
- Try not to deploy bugs.
- If you screw up, try not to do it the same way twice.
- Accept that crap happens, live, learn, and move on.
That’s all of the major bits of our deployment process. But as always, ask any questions you have in comments below and you’ll get an answer.
I want to take a minute and thank the teams at Stack Overflow here. We build all of this, together. Many people help me review these blog posts before they go out to make sure everything is accurate. The posts are not short, and several people are reviewing them in off-hours because they simply saw a post in chat and wanted to help out. These same people hop into comment threads here, on Reddit, on Hacker News, and other places discussions pop up. They answer questions as they arise or relay them to someone who can answer. They do this on their own, out of a love for the community. I’m tremendously appreciative of their effort and it’s a privilege to work with some of the best programmers and sysadmins in the world. My lovely wife Elise also gives her time to help edit these before they go live. To all of you: thanks.
What’s next? The way this series works is I blog in order of what the community wants to know about most. Going by the Trello board, it looks like Monitoring is the next most interesting topic. So next time expect to learn how we monitor all of the systems here at Stack. I’ll cover how we monitor servers and services as well as the performance of Stack Overflow 24/7 as users see it all over the world. I’ll also cover many of the monitoring tools we’re using and have built; we’ve open sourced several big ones. Thanks for reading this post which ended up way longer than I envisioned and see you next time.
五、Stack Overflow: How We Do Monitoring - 2018 Edition
This is #4 in a very long series of posts on Stack Overflow’s architecture. Previous post (#3): Stack Overflow: How We Do Deployment - 2016 Edition
What is monitoring? As far as I can tell, it means different things to different people. But we more or less agree on the concept. I think. Maybe. Let’s find out! When someone says monitoring, I think of:

…but evidently some people think of other things. Those people are obviously wrong, but let’s continue. When I’m not a walking zombie after reading a 10,000 word blog post some idiot wrote, I see monitoring as the process of keeping an eye on your stuff, like a security guard sitting at a desk full of cameras somewhere. Sometimes they fall asleep–that’s monitoring going down. Sometimes they’re distracted with a doughnut delivery–that’s an upgrade outage. Sometimes the camera is on a loop–I don’t know where I was going with that one, but someone’s probably robbing you. And then you have the fire alarm. You don’t need a human to trigger that. The same applies when a door gets opened, maybe that’s wired to a siren. Or maybe it’s not. Or maybe the siren broke in 1984.
I know what you’re thinking: Nick, what the hell? My point is only that monitoring any application isn’t that much different from monitoring anything else. Some things you can automate. Some things you can’t. Some things have thresholds for which alarms are valid. Sometimes you’ll get those thresholds wrong (especially on holidays). And sometimes, when setting up further automation isn’t quite worth it, you just make using human eyes easier.
What I’ll discuss here is what we do. It’s not the same for everyone. What’s important and “worth it” will be different for almost everyone. As with everything else in life, it’s full of trade-off decisions. Below are the ones we’ve made so far. They’re not perfect. They are evolving. And when new data or priorities arise, we will change earlier decisions when it warrants doing so. That’s how brains are supposed to work.
And once again this post got longer and longer as I wrote it (but a lot of pictures make up that scroll bar!). So, links for your convenience:
- Types of Data
- Logs
- Health Checks
- Metrics
- Alerting
- Bosun
- Grafana
- Client Timings
- MiniProfiler
- Opserver
- Where Do We Go Next?
- Tools Summary
Types of Data
Monitoring generally consists of a few types of data (I’m absolutely arbitrarily making some groups here):
- Logs: Rich, detailed text and data but not awesome for alerting
- Metrics: Tagged numbers of data for telemetry–good for alerting, but lacking in detail
- Health Checks: Is it up? Is it down? Is it sideways? Very specific, often for alerting
- Profiling: Performance data from the application to see how long things are taking
- …and other complex combinations for specific use cases that don’t really fall into any one of these.
Logs
Let’s talk about logs. You can log almost anything!
- Info messages? Yep.
- Errors? Heck yeah!
- Traffic? Sure!
- Email? Careful, GDPR.
- Anything else? Well, I guess.
Sounds good. I can log whatever I want! What’s the catch? Well, it’s a trade-off. Have you ever run a program with tons of console output? Run the same program without it? Goes faster, doesn’t it? Logging has a few costs. First, you often need to allocate strings for the logging itself. That’s memory and garbage collection (for .NET and some other platforms). When you’re logging somewhere, that usually that means disk space. If we’re traversing a network (and to some degree locally), it also means bandwidth and latency.
…and I was just kidding about GDPR only being a concern for email…GDPR is a concern for all of the above. Keep retention and compliance in mind when logging anything. It’s another cost to consider.
Let’s say none of those are significant problems and we want to log all the things. Tempting, isn’t it? Well, then we can have too much of a good thing. What happens when you need to look at those logs? It’s more to dig through. It can make finding the problem much harder and slower. With all logging, it’s a balance of logging what you think you’ll need vs. what you end up needing. You’ll get it wrong. All the time. And you’ll find a newly added feature didn’t have the right logging when things went wrong. And you’ll finally figure that out (probably after it goes south)…and add that logging. That’s life. Improve and move on. Don’t dwell on it, just take the lesson and learn from it. You’ll think about it more in code reviews and such afterwards.
So what do we log? It depends on the system. For any systems we build, we *always* log errors. (Otherwise, why even throw them?). We do this with StackExchange.Exceptional, an open source .NET error logger I maintain. It logs to SQL Server. These are viewable in-app or via Opserver (which we’ll talk more about in a minute).
For systems like Redis, Elasticsearch, and SQL Server, we’re simply logging to local disk using their built-in mechanisms for logging and log rotation. For other SNMP-based systems like network gear, we forward all of that to our Logstash cluster which we have Kibana in front of for querying. A lot of the above is also queried at alert time by Bosun for details and trends, which we’ll dive into next.
Logs: HAProxy
We also log a minimal summary of public HTTP requests (only top level…no cookies, no form data, etc.) that go through HAProxy (our load balancer) because when someone can’t log in, an account gets merged, or any of a hundred other bug reports come in it’s immensely valuable to go see what flow led them to disaster. We do this in SQL Server via clustered columnstore indexes. For the record, Jarrod Dixon first suggested and started the HTTP logging about 8 years ago and we all told him he was an insane lunatic and it was a tremendous waste of resources. Please no one tell him he was totally right. A new per-month storage format will be coming soon, but that’s another story.
In those requests, we use profiling that we’ll talk about shortly and send headers to HAProxy with certain performance numbers. HAProxy captures and strips those headers into the syslog row we forward for processing into SQL. Those headers include:
- ASP.NET Overall Milliseconds (encompasses those below)
- SQL Count (queries) & Milliseconds
- Redis Count (hits) & Milliseconds
- HTTP Count (requests sent) & Milliseconds
- Tag Engine Count (queries) & Milliseconds
- Elasticsearch Count (hits) & Milliseconds
If something gets better or worse we can easily query and compare historical data. It’s also useful in ways we never really thought about. For example, we’ll see a request and the count of SQL queries run and it’ll tell us how far down a code path a user went. Or when SQL connection pools pile up, we can look at all requests from a particular server at a particular time to see what caused that contention. All we’re doing here is tracking a count of calls and time for n services. It’s super simple, but also extremely effective.
The thing that listens for syslog and saves to SQL is called the Traffic Processing Service, because we planned for it to send reports one day.
Alongside those headers, the default HAProxy log row format has a few other timings per request:
- TR: Time a client took to send us the request (fairly useless when keepalive is in play)
- Tw: Time spent waiting in queues
- Tc: Time spent waiting to connect to the web server
- Tr: Time the web server took to fully render a response
As another example of simple but important, the delta between Tr and the AspNetDurationMs header (a timer started and ended on the very start and tail of a request) tells us how much time was spent in the OS, waiting for a thread in IIS, etc.
Health Checks
Health checks are things that check…well, health. “Is this healthy?” has four general answers:
- Yes: “ALL GOOD CAPTAIN!”
- No: “@#$%! We’re down!”
- Kinda: “Well, I guess we’re technically online…”
- Unknown: “No clue…they won’t answer the phone”
The conventions on these are generally green, red, yellow, and grey (or gray, whatever) respectively. Health checks have a few general usages. In any load distribution setup such as a cluster of servers working together or a load balancer in front of a group of servers, health checks are a way to see if a member is up to a role or task. For example in Elasticsearch if a node is down, it’ll rebalance shards and load across the other members…and do so again when the node returns to healthy. In a web tier, a load balancer will stop sending traffic to a down node and continue to balance it across the healthy ones.
For HAProxy, we use the built-in health checks with a caveat. As of late 2018 when I’m writing this post, we’re in ASP.NET MVC5 and still working on our transition to .NET Core. An important detail is that our error page is a redirect, for example /questions to /error?aspxerrorpath=/questions. It’s an implementation detail of how the old .NET infrastructure works, but when combined with HAProxy, it’s an issue. For example if you have:
server ny-web01 10.x.x.1:80 check
…then it will accept a 200-399 HTTP status code response. (Also remember: it’s making a HEAD request only.) A 400 or 500 will trigger unhealthy, but our 302 redirect will not. A browser would get a 5xx status code *after following the redirect*, but HAProxy isn’t doing that. It’s only doing the initial hit and a “healthy” 302 is all it sees. Luckily, you can change this with http-check expect 200 (or any status code or range or regex–here are the docs) on the same backend. This means only a 200 is allowed from our health check endpoint. Yes, it’s bitten us more than once.
Different apps vary on what the health check endpoint is, but for stackoverflow.com, it’s the home page. We’ve debated changing this a few times, but the reality is the home page checks things we may not otherwise check, and a holistic check is important. By this I mean, “If users hit the same page, would it work?” If we made a health check that hit the database and some caches and sanity checked the big things that we know need to be online, that’s great and it’s way better than nothing. But let’s say we put a bug in the code and a cache that doesn’t even seem that important doesn’t reload right and it turns out it was needed to render the top bar for all users. It’s now breaking every page. A health check route running some code wouldn’t trigger, but just the act of loading the master view ensures a huge number of dependencies are evaluated and working for the check.
If you’re curious, that’s not a hypothetical. You know that little dot on the review queue that indicates a lot of items currently in queue? Yeah…fun Tuesday.
We also have health checks inside libraries. The simplest manifestation of this is a heartbeat. This is something that for example StackExchange.Redis uses to routinely check if the socket connection to Redis is active. We use the same approach to see if the socket is still open and working to websocket consumers on Stack Overflow. This is a monitoring of sorts not heavily used here, but it is used.
Other health checks we have in place include our tag engine servers. We could load balance this through HAProxy (which would add a hop) but making every web tier server aware of every tag server directly has been a better option for us. We can 1) choose how to spread load, 2) much more easily test new builds, and 3) get per-server op count counts metrics and performance data. All of that is another post, but for this topic: we have a simple “ping” health check that pokes the tag server once a second and gets just a little data from it, such as when it last updated from the database.
So, that’s a thing. Your health checks can absolutely be used to communicate as much state as you want. If having it provides some advantage and the overhead is worth it (e.g. are you running another query?), have at it. The Microsoft .NET team has been working on a unified way to do health checks in ASP.NET Core, but I’m not sure if we’ll go that way or not. I hope we can provide some ideas and unify things there when we get to it…more thoughts on that towards the end.
However, keep in mind that health checks also generally run often. Very often. Their expense and expansiveness should be related to the frequency they’re running at. If you’re hitting it once every 100ms, once a second, once every 5 seconds, or once a minute, what you’re checking and how many dependencies are evaluated (and take a while to check…) very much matters. For example a 100ms check can’t take 200ms. That’s trying to do too much.
Another note here is a health check can generally reflect a few levels of “up”. One is “I’m here”, which is as basic as it gets. The other is “I’m ready to serve”. The latter is much more important for almost every use case. But don’t phrase it quite like that to the machines, you’ll want to be in their favor when the uprising begins.
A practical example of this happens at Stack Overflow: when you flip an HAProxy backend server from MAINT (maintenance mode) to ENABLE, the assumption is that the backend is up until a health check says otherwise. However, when you go from DRAIN to ENABLE, the assumption is the service is down, and must pass 3 health checks before getting traffic. When we’re dealing with thread pool growth limitations and caches trying to spin up (like our Redis connections), we can get very nasty thread pool starvation issues because of how the health check behaves. The impact is drastic. When we spin up slowly from a drain, it takes about 8-20 seconds to be fully ready to serve traffic on a freshly built web server. If we go from maintenance which slams the server with traffic during startup, it takes 2-3 minutes. The health check and traffic influx may seem like salient details, but it’s critical to our deployment pipeline.
Health Checks: httpUnit
An internal tool (again, open sourced!) is httpUnit. It’s a fairly simple-to-use tool we use to check endpoints for compliance. Does this URL return the status code we expect? How about some text to check for? Is the certificate valid? (We couldn’t connect if it isn’t.) Does the firewall allow the rule?
By having something continually checking this and feeding into alerts when it fails, we can quickly identify issues, especially those from invalid config changes to the infrastructure. We can also readily test new configurations or infrastructure, firewall rules, etc. before user load is applied. For more details, see the GitHub README.
Health Checks: Fastly
If we zoom out from the data center, we need to see what’s hitting us. That’s usually our CDN & proxy: Fastly. Fastly has a concept of services, which are akin to HAProxy backends when you think about it like a load balancer. Fastly also has health checks built in. In each of our data centers, we have two sets of ISPs coming in for redundancy. We can configure things in Fastly to optimize uptime here.
Let’s say our NY data center is primary at the moment, and CO is our backup. In that case, we want to try:
- NY primary ISPs
- NY secondary ISPs
- CO primary ISPs
- CO secondary ISPs
The reason for primary and secondary ISPs has to do with best transit options, commits, overages, etc. With that in mind, we want to prefer one set over another. With health checks, we can very quickly failover from #1 through #4. Let’s say someone cuts the fiber on both ISPs in #1 or BGP goes wonky, then #2 kicks in immediately. We may drop thousands of requests before it happens, but we’re talking about an order of seconds and users just refreshing the page are probably back in business. Is it perfect? No. Is it better than being down indefinitely? Hell yeah.
Health Checks: External
We also use some external health checks. Monitoring a global service, well…globally, is important. Are we up? Is Fastly up? Are we up here? Are we up there? Are we up in Siberia? Who knows!? We could get a bunch of nodes on a bunch of providers and monitor things with lots of set up and configuration…or we could just pay someone many orders of magnitude less money to outsource it. We use Pingdom for this. When things go down, it alerts us.
Metrics
What are metrics? They can take a few forms, but for us they’re tagged time series data. In short, this means you have a name, a timestamp, a value, and in our case, some tags. For example, a single entry looks like:
- Name:
dotnet.memory.gc_collections - Time:
2018-01-01 18:30:00(Of course it’s UTC, we’re not barbarians.) - Value:
129,389,139 - Tags: Server:
NY-WEB01, Application:StackExchange-Network
The value in an entry can also take a few forms, but the general case is counters. Counters report an ever-increasing value (often reset to 0 on restarts and such though). By taking the difference in value over time, you can find out the value delta in that window. For example, if we had 129,389,039 ten minutes before, we know that process on that server in those ten minutes ran 100 Gen 0 garbage collection passes. Another case is just reporting an absolute point-in-time value, for example “This GPU is currently 87°”. So what do we use to handle Metrics? In just a minute we’ll talk about Bosun.
Alerting
Alrighty, what do we do with all that data? ALERTS! As we all know, “alert” is an anagram that comes from “le rat”, meaning “one who squealed to authorities”.
This happens at several levels and we customize it to the team in question and how they operate best. For the SRE (Site Reliability Engineering) team, Bosun is our primary alerting source internally. For a detailed view of how alerts in Bosun work, I recommend watching Kyle’s presentation at LISA (starting about 15 minutes in). In general, we’re alerting when:
- Something is down or warning directly (e.g. iDRAC logs)
- Trends don’t match previous trends (e.g. fewer
xevents than normal–fun fact: this tends to false alarm over the holidays) - Something is heading towards a wall (e.g. disk space or network maxing out)
- Something is past a threshold (e.g. a queue somewhere is building)
…and lots of other little things, but those are the big categories that come to mind.
If any problems are bad enough, we go to the next level: waking someone up. That’s when things get real. Some things that we monitor do not pass go and get their $200. They just go straight to PagerDuty and wake up the on-call SRE. If that SRE doesn’t acknowledge, it escalates to another soon after. Significant others love when all this happens! Things of this magnitude are:
- stackoverflow.com (or any other important property) going offline (as seen by Pingdom)
- Significantly high error rates
Now that we have all the boring stuff out of the way, let’s dig into the tools. Yummy tools!
Bosun
Bosun is our internal data collection tool for metrics and metadata. It’s open source. Nothing out there really did what we wanted with metrics and alerting, so Bosun was created about four years ago and has helped us tremendously. We can add the metrics we want whenever we want, new functionality as we need, etc. It has all the benefits of an in-house system. And it has all of the costs too. I’ll get to that later. It’s written in Go, primarily because the vast majority of the metrics collection is agent-based. The agent, scollector (heavily based on principles from tcollector) needed to run on all platforms and Go was our top choice for this. “Hey Nick, what about .NET Core??” Yeah, maybe, but it’s not quite there yet. The story is getting more compelling, though. Right now we can deploy a single executable very easily and Go is still ahead there.
Bosun is backed by OpenTSDB for storage. It’s a time-series database built on top of HBase that’s made to be very scalable. At least that’s what people tell us. The problems we hit at Stack Exchange/Stack Overflow usually come from efficiency and throughput perspectives. We do a lot with a little hardware. In some ways, this is impressive and we’re proud of it. In other ways, it bends and breaks things that aren’t designed to run that way. In the OpenTSDB case, we don’t need lots of hardware to run it from a space standpoint, but the way HBase is designed we have to give it more hardware (especially on the network front). It’s an HBase replication issue when dealing with tiny amounts of data that I don’t want to get too far into here, as that’s a post all by itself. A long one. For some definition of long.
Let’s just say it’s a pain in the ass and it costs money to work around, so much so that we’ve tried to get Bosun backed by SQL Server clustered column store indexes instead. We have this working, but the queries for certain cardinalities aren’t spectacular and cause high CPU usage. Things like getting aggregate bandwidth for the Nexus switch cores summing up 400x more data points than most other metrics is not awesome. Most stuff runs great. Logging 50–100k metrics per second only uses ~5% CPU on a decent server–that’s not an issue. Certain queries are the pain point and we haven’t returned to that problem…it’s a “maybe” on if we can solve it and how much time that would take. Anyway, that’s another post too.
If you want to know more about our Bosun setup and configuration, Kyle Brandt has an awesome architecture post here.
Bosun: Metrics
In the .NET case, we’re sending metrics with BosunReporter, another open source NuGet library we maintain. It looks like this:
// Set it up once globally
var collector = new MetricsCollector(new BosunOptions(ex => HandleException(ex))
{
	MetricsNamePrefix = "MyApp",
	BosunUrl = "https://bosun.mydomain.com",
	PropertyToTagName = NameTransformers.CamelToLowerSnakeCase,
	DefaultTags = new Dictionary<string, string>
		{ {"host", NameTransformers.Sanitize(Environment.MachineName.ToLower())} }
});

// Whenever you want a metric, create one! This should be likely be static somewhere
// Arguments: metric name, unit name, description
private static searchCounter = collector.CreateMetric<Counter>("web.search.count", "searches", "Searches against /search");

// ...and whenever the event happens, increment the counter
searchCounter.Increment();
That’s pretty much it. We now have a counter of data flowing into Bosun. We can add more tags–for example, we are including which server it’s happening on (via the host tag), but we could add the application pool in IIS, or the Q&A site the user’s hitting, etc. For more details, check out the BosunReporter README. It’s awesome.
Many other systems can send metrics, and scollector has a ton built-in for Redis, Windows, Linux, etc. Another external example that we use for critical monitoring is a small Go service that listens to the real-time stream of Fastly logs. Sometimes Fastly may return a 503 because it couldn’t reach us, or because…who knows? Anything between us and them could go wrong. Maybe it’s severed sockets, or a routing issue, or a bad certificate. Whatever the cause, we want to alert when these requests are failing and users are feeling it. This small service just listens to the log stream, parses a bit of info from each entry, and sends aggregate metrics to Bosun. This isn’t open source at the moment because…well I’m not sure we’ve ever mentioned it exists. If there’s demand for such a thing, shout and we’ll take a look.
Bosun: Alerting
A key feature of Bosun I really love is the ability to test an alert against history while designing it. This helps seeing when it would have triggered. It’s an awesome sanity check. Let’s be honest, monitoring isn’t perfect, it was never perfect, and it won’t ever be perfect. A lot of monitoring comes from lessons learned, because the things that go wrong often include things you never even considered going wrong…and that means you didn’t have monitoring and/or alerts on them from day 1. Alerts are often added after something goes wrong. Despite your best intentions and careful planning, you will miss things and alerts will be added after the first incident. That’s okay. It’s in the past. All you can do now is make things better in the hopes that it doesn’t happen again. Whether you’re designing ahead of time or in retrospect, this feature is awesome:


You can see on November 18th there was one system that got low enough to trigger a warning here, but otherwise all green. Sanity checking if an alert is noisy before anyone ever gets notified? I love it.
And then we have critical errors that are so urgent they need to be addressed ASAP. For those cases, we post them to our internal chat rooms. These are things like errors creating a Stack Overflow Team (You’re trying to give us money and we’re erroring? Not. Cool.) or a scheduled task is failing. We also have metrics monitoring (via Bosun) errors in a few ways:
- From our Exceptional error logs (summed up per application)
- From Fastly and HAProxy
If we’re seeing a high error rate for any reason on either of these, messages with details land in chat a minute or two after. (Since they’re aggregate count based, they can’t be immediate.)

These messages with links let us quickly dig into the issue. Did the network blip? Is there a routing issue between us and Fastly (our proxy and CDN)? Did some bad code go out and it’s erroring like crazy? Did someone trip on a power cable? Did some idiot plug both power feeds into the same failing UPS? All of these are extremely important and we want to dig into them ASAP.
Another way alerts are relayed is email. Bosun has some nice functionality here that assists us. An email may be a simple alert. Let’s say disk space is running low or CPU is high and a simple graph of that in the email tells a lot. …and then we have more complex alerts. Let’s say we’re throwing over our allowed threshold of errors in the shared error store. Okay great, we’ve been alerted! But…which app was it? Was it a one-off spike? Ongoing? Here’s where the ability to define queries for more data from SQL or Elasticsearch come in handy (remember all that logging?). We can add breakdowns and details to the email itself. You can be better informed to handle (or even decide to ignore) an email alert without digging further. Here’s an example email from NY-TSDB03’s CPU spiking a few days ago:


We also include the last 10 incidents for this alert on the systems in question so you can easily identify a pattern, see why they were dismissed, etc. They’re just not in this particular email I was using as an example.
Grafana
Okay cool. Alerts are nice, but I just want to see some data… I got you fam!
After all, what good is all that data if you can’t see it? Presentation and accessibility matter. Being able to quickly consume the data is important. Graphical vizualizations for time series data are an excellent way of exploring. When it comes to monitoring, you have to either 1) be looking at the data, or 2) have rock solid 100% coverage with alerts so no one has to ever look at the data. And #2 isn’t possible. When a problem is found, often you’ll need to go back and see when it started. “HOW HAVE WE NOT NOTICED THIS IN 2 WEEKS?!?” isn’t as uncommon as you’d think. So, historical views help.
This is where we use Grafana. It’s an excellent open source tool, for which we provide a Bosun plugin so it can be a data source. (Technically you can use OpenTSDB directly, but this adds functionality.) Our use of Grafana is probably best explained in pictures, so a few examples are in order.
Here’s a status dashboard showing how Fastly is doing. Since we’re behind them for DDoS protection and faster content delivery, their current status is also very much our current status.

This is just a random dashboard that I think is pretty cool. It’s traffic broken down by country of origin. It’s split into major continents and you can see how traffic rolls around the world as people are awake.

If you follow me on Twitter, you’re likely aware we’re having some garbage collection issues with .NET Core. Needing to keep an eye on this isn’t new though. We’ve had this dashboard for years:

Note: Don’t go by any numbers above for scale of any sort, these screenshots were taken on a holiday weekend.
Client Timings
An important note about *everything* above is that it’s server side. Did you think about it until now? If you did, awesome. A lot of people don’t think that way until one day when it matters. But it’s always important.
It’s critical to remember that how fast you render a webpage doesn’t matter. Yes, I said that. It doesn’t matter, not directly anyway. The only thing that matters is how fast users think your site is. How fast does it feel? This manifests in many ways on the client experience, from the initial painting of a page to when content blinks in (please don’t blink or shift!), ads render, etc.
Things that factor in here are, for example, how long did it take to…
- Connect over TCP? (HTTP/3 isn’t here yet)
- Negotiate the TLS connection?
- Finish sending the request?
- Get the first byte?
- Get the last byte?
- Initially paint the page?
- Issue requests for resources in the page?
- Render all the things?
- Finish attaching JavaScript handlers?
…hmmm, good questions! These are the things that matter to the user experience. Our question pages render in 18ms. I think that’s awesome. And I might even be biased. …but it also doesn’t mean crap to a user if it takes forever to get to them.
So, what can we do? Years back, I threw together a client timings pipeline when the pieces we needed first became available in browsers. The concept is simple: use the navigation timings API available in web browsers and record it. That’s it. There’s some sanity checks in there (you wouldn’t believe the number of NTP clock corrections that yield invalid timings from syncs during a render making clocks go backwards…), but otherwise that’s pretty much it. For 5% of requests to Stack Overflow (or any Q&A site on our network), we ask the browser to send these timings. We can adjust this percentage at will.
For a description of how this works, you can visit teststackoverflow.com. Here’s what it looks like:


This domain isn’t exactly monitoring, but it kind of is. We use it to test things like when we switched to HTTPS what the impact for everyone would be with connection times around the world (that’s why I originally created the timings pipeline). It was also used when we added DNS providers, something we now have several of after the Dyn DNS attack in 2016. How? Sometimes I sneakily embed it as an <iframe> on stackoverflow.com to throw a lot of traffic at it so we can test something. But don’t tell anyone, it’ll just be between you and me.
Okay, so now we have some data. If we take that for 5% of traffic, send it to a server, plop it in a giant clustered columnstore in SQL and send some metrics to Bosun along the way, we have something useful. We can test before and after configs, looking at the data. We can also keep an eye on current traffic and look for problems. We use Grafana for the last part, and it looks like this:

Note: that’s a 95% percentile view, the median total render time is the white dots towards the bottom (under 500ms most days).
MiniProfiler
Sometimes the data you want to capture is more specific and detailed than the scenarios above. In our case, we decided almost a decade ago that we wanted to see how long a webpage takes to render in the corner of every single page view. Equally important to monitoring anything is looking at it. Making it visible on every single page you look at is a good way of making that happen. And thus, MiniProfiler was born. It comes in a few flavors (the projects vary a bit): .NET, Ruby, Go, and Node.js. We’re looking at the .NET version I maintain here:

The number is all you see by default, but you can expand it to see a breakdown of which things took how long, in tree form. The commands that are linked there are also viewable, so you can quickly see the SQL or Elastic query that ran, or the HTTP call made, or the Redis key fetched, etc. Here’s what that looks like:

Note: If you’re thinking, that’s *way* longer than we say our question renders take on average (or even 99th percentile), yes, it is. That’s because I’m a moderator here and we load a lot more stuff for moderators.
Since MiniProfiler has minimal overhead, we can run it on every request. To that end, we keep a sample of profiles per-MVC-route in Redis. For example, we keep the 100 slowest profiles of any route at a given time. This allows us to see what users may be hitting that we aren’t. Or maybe anonymous users use a different query and it’s slow…we need to see that. We can see the routes being slow in Bosun, the hits in HAProxy logs, and the profile snapshots to dig in. All of this without seeing any code at all, that’s a powerful overview combination. MiniProfiler is awesome (like I’m not biased…) but it is also part of a bigger set of tools here.
Here’s a view of what those snapshots and aggregate summaries looks like:
| Snapshots | Summary |
|---|---|
 |
 |
…we should probably put an example of that in the repo. I’ll try and get around to it soon.
MiniProfiler was started by Marc Gravell, Sam Saffron, and Jarrod Dixon. I am the primary maintainer since 4.x, but these gentleman are responsible for it existing. We put MiniProfiler in all of our applications.
Note: see those GUIDs in the screenshots? That’s MiniProfiler just generating an ID. We now use that as a “Request ID” and it gets logged in those HAProxy logs and to any exceptions as well. Little things like this help tie the world together and let you correlate things easily.
Opserver
So, what is Opserver? It’s a web-based dashboard and monitoring tool I started when SQL Server’s built-in monitoring lied to us one day. About 5 years ago, we had an issue where SQL Server AlwaysOn Availability Groups showed green on the SSMS dashboard (powered by the primary), but the replicas hadn’t seen new data for days. This was an example of extremely broken monitoring. What happened was the HADR thread pool exhausted and stopped updating a view that had a state of “all good”. I’d link you to the Connect item but they just deleted them all. I’m not bitter. The design of such isn’t necessarily flawed, but when caching/storing the state of a thing, it needs to have a timestamp. If it hasn’t been updated in <pick a threshold>, that’s a red alert. Nothing about the state can be trusted. Anyway, enter Opserver. The first thing it did was monitor each SQL node rather than trusting the master.
Since then, I’ve added monitoring for our other systems we wanted in a quick web-based view. We can see all servers (based on Bosun, or Orion, or WMI directly). Here is an overview of where Opserver is today:
Opserver: Primary Dashboard
The landing dashboard is a server list showing an overview of what’s up. Users can search by name, service tag, IP address, VM host, etc. You can also drill down to all-time history graphs for CPU, memory, and network on each node.

Within each node looks like this:

If using Bosun and running Dell servers, we’ve added hardware metadata like this:

Opserver: SQL Server
In the SQL dashboard, we can see server status and how the availability groups are doing. We can see how much activity each node has and which one is primary (in blue) at any given time. The bottom section is AlwaysOn Availability Groups, we can see who’s primary for each, how far behind replication is, and how much queues are backed up. If things go south and a replica is unhealthy, some more indicators pop in like which databases are having issues and the free disk space on the primary for all drives involved in T-logs (since they will start growing if replication remains down):

There’s also a top-level all-jobs view for quick monitoring and enabling/disabling:

And in the per-instance view we can see the stats about the server, caches, etc., that we’ve found relevant over time.

For each instance, we also report top queries (based on plan cache, not query store yet), active-right now queries (based on sp_whoisactive), connections, and database info.


…and if you want to drill down into a top query, it looks like this:

In the databases view, there are drill downs to see tables, indexes, views, stored procedures, storage usage, etc.


Opserver: Redis
For Redis, we want to see the topology chain of primary and replicas as well as the overall status of each instance:


Note that you can kill client connections, get the active config, change server topologies, and analyze the data in each database (configurable via Regexes). The last one is a heavy KEYS and DEBUG OBJECT scan, so we run it on a replica node or are allowed to force running it on a master (for safety). Analysis looks like this:

Opserver: Elasticsearch
For Elasticsearch, we usually want to see things in a cluster view since that’s how it behaves. What isn’t seen below is that when an index goes yellow or red. When that happens, new sections of the dashboard appear showing shards that are in trouble, what they’re doing (initializing, relocating, etc.), and counts appear in each cluster summarizing how many are in which status.


Note: the PagerDuty tab up there pulls from the PagerDuty API and displays on-call information, who’s primary, secondary, allows you to see and claim incidents, etc. Since it’s almost 100% not data you’d want to share, there’s no screenshot here. :) It also has a configurable raw HTML section to give visitors instructions on what to do or who to reach out to.
Opserver: Exceptions
Exceptions in Opserver are based on StackExchange.Exceptional. In this case specifically, we’re looking at the SQL Server storage provider for Exceptional. Opserver is a way for many applications to share a single database and table layout and have developers view their exceptions in one place.

The top level view here can just be applications (the default), or it can be configured in groups. In the above case, we’re configuring application groups by team so a team can bookmark or quickly click on the exceptions they’re responsible for. In the per-exception page, the detail looks like this:


There are also details recorded like request headers (with security filters so we don’t log authentication cookies for example), query parameters, and any other custom data added to an exception.
Note: you can configure multiple stores, for instance we have New York and Colorado above. These are separate databases allowing all applications to log to a very-local store and still get to them from a single dashboard.
Opserver: HAProxy
The HAProxy section is pretty straightforward–we’re simply presenting the current HAProxy status and allowing control of it. Here’s what the main dashboard looks like:

For each background group, specific backend server, entire server, or entire tier, it also allows some control. We can take a backend server out of rotation, or an entire backend down, or a web server out of all backends if we need to shut it down for emergency maintenance, etc.

Opserver: FAQs
I get the same questions about Opserver routinely, so let’s knock a few of them out:
-
Opserver does
not
require a data store of any kind for itself (it’s all config and in-memory state).
- This may happen in the future to enhance functionality, but there are no plans to require anything.
-
Only the dashboard tab and per-node view is powered by Bosun, Orion, or WMI - all other screens like SQL, Elastic, Redis, etc. have no dependency…Opserver monitors these directly.
-
Authentication is both global and per-tab pluggable (who can view and who’s an admin are separate), but built-in configuration is via groups and Active Directory is included.
- On admin vs. viewer: A viewer gets a read-only view. For example, HAProxy controls wouldn’t be shown.
-
All tabs are not required–each is independent and only appears if configured.
- For example, if you wanted to only use Opserver as an Elastic or Exceptions dashboard, go nuts.
Note: Opserver is currently being ported to ASP.NET Core as I have time at night. This should allow it to run without IIS and hopefully run on other platforms as well soon. Some things like AD auth to SQL Servers from Linux and such is still on the figure-it-out list. If you’re looking to deploy Opserver, just be aware deployment and configuration will change drastically soon (it’ll be simpler) and it may be better to wait.
Where Do We Go Next?
Monitoring is an ever-evolving thing. For just about everyone, I think. But I can only speak of plans I’m involved in…so what do we do next?
Health Check Next Steps
Health check improvements are something I’ve had in mind for a while, but haven’t found the time for. When you’re monitoring things, the source of truth is a matter of concern. There’s what a thing is*** and what a thing **should be*. Who defines the latter? I think we can improve things here on the dependency front and have it generally usable across the board (…and I really hope someone’s already doing similar, tell me if so!). What if we had a simple structure from the health checks like this:
public class HealthResult
{
    public string AppName { get; set; }
    public string ServerName { get; set; }
    public HealthStatus Status { get; set; }
    public List<string> Tags { get; set; }
    public List<HealthResult> Dependencies { get; set; }
    public Dictionary<string, string> Attributes { get; set; }
}
public enum HealthStatus
{
    Healthy,
    Warning,
    Critical,
    Unknown
}
This is just me thinking out loud here, but the key part is the Dependencies. What if you asked a web server “Hey buddy, how ya doing?” and it returned not a simple JSON object, but a tree of them? But each level is all the same thing, so overall we’d have a recursive list of dependencies. For example, a dependency list that included Redis–if we couldn’t reach 1 of 2 Redis nodes, we’d have 2 dependencies in the list, a Healthy for one and a Critical or Unknown for the other in the dependency list and the web server would be Warning instead of Healthy.
The main point here is: the monitoring system doesn’t need to know about dependencies. The systems themselves define them and return them. This way we don’t get into config skew where what’s being monitored doesn’t match what should be there. This can happen often in deployments with topology or dependency changes.
This may be a terrible idea, but it’s a general one I have for Opserver (or any script really) to get a health reading and the why of a health reading. If we lose another node, these n things break. Or, we see the common cause of n health warnings. By pointing at a few endpoints, we could get a tree view of everything. Need to add more data for your use case? Sure! It’s JSON, so just inherit from the object and add more stuff as needed. It’s an easily extensible model. I think. I need to take the time to build this…maybe it’s full of problems. Or maybe someone reading this will tell me it’s already done (hey you!).
Bosun Next Steps
Bosun has largely been in maintenance mode due to a lack of resources and other priorities. We haven’t done as much as we’d like because we need to have the discussion on the best path forward. Have other tools caught up and filled the gaps that caused us to build it in the first place? Has SQL 2017 or 2019 already improved the queries we had issues with lowering the bar greatly? We need to take some time and look at the landscape and evaluate what we want to do. This is something we want to get into during Q1 2019.
We know of some things we’d like to do, such as improving the alert editing experience and some other UI areas. We just need to weigh some things and figure out where our time is best spent as with all things.
Metrics Next Steps
We are drastically under-utilizing metrics across our applications. We know this. The system was built for SREs and developers primarily, but showing developers all the benefits and how powerful metrics are (including how easy they are to add) is something we haven’t done well. This is a topic we discussed at a company meetup last month. They’re so, so cheap to add and we could do a lot better. Views differ here, but I think it’s mostly a training and awareness issue we’ll strive to improve.
The health checks above…maybe we easily allow integrating metrics from BosunReporter there as well (probably only when asked for) to make one decently powerful API to check the health and status of a service. This would allow a pull model for the same metrics we normally push. It needs to be as cheap as possible and allocate little, though.
Tools Summary
I mentioned several tools we’ve built and open sourced above. Here’s a handy list for reference:
- Bosun: Go-based monitoring and alerting system – primary developed by Kyle Brandt, Craig Peterson, and Matt Jibson.
- Bosun: Grafana Plugin: A data source plugin for Grafana – developed by Kyle Brandt.
- BosunReporter: .NET metrics collector/sender for Bosun – developed by Bret Copeland.
- httpUnit: Go-based HTTP monitor for testing compliance of web endpoints – developed by Matt Jibson and Tom Limoncelli.
- MiniProfiler: .NET-based (with other languages available like Node and Ruby) lightweight profiler for seeing page render times in real-time – created by Marc Gravell, Sam Saffron, and Jarrod Dixon and maintained by Nick Craver.
- Opserver: ASP.NET-based monitoring dashboard for Bosun, SQL, Elasticsearch, Redis, Exceptions, and HAProxy – developed by Nick Craver.
- StackExchange.Exceptional: .NET exception logger to SQL, MySQL, Postgres, etc. – developed by Nick Craver.
…and all of these tools have additional contributions from our developer and SRE teams as well as the community at large.
What’s next? The way this series works is I blog in order of what the community wants to know about most. Going by the Trello board, it looks like Caching is the next most interesting topic. So next time expect to learn how we cache data both on the web tier and Redis, how we handle cache invalidation, and take advantage of pub/sub for various tasks along the way.
六、Stack Overflow: How We Do App Caching - 2019 Edition
This is #5 in a very long series of posts on Stack Overflow’s architecture. Previous post (#4): Stack Overflow: How We Do Monitoring - 2018 Edition
So…caching. What is it? It’s a way to get a quick payoff by not re-calculating or fetching things over and over, resulting in performance and cost wins. That’s even where the name comes from, it’s a short form of the “ca-ching!” cash register sound from the dark ages of 2014 when physical currency was still a thing, before Apple Pay. I’m a dad now, deal with it.
Let’s say we need to call an API or query a database server or just take a bajillion numbers (Google says that’s an actual word, I checked) and add them up. Those are all relatively crazy expensive. So we cache the result – we keep it handy for re-use.
Why Do We Cache?
I think it’s important here to discuss just how expensive some of the above things are. There are several layers of caching already in play in your modern computer. As a concrete example, we’re going to use one of our web servers which currently houses a pair of Intel Xeon E5-2960 v3 CPUs and 2133MHz DIMMs. Cache access is a “how many cycles” feature of a processor, so by knowing that we always run at 3.06GHz (performance power mode), we can derive the latencies (Intel architecture reference here – these processors are in the Haswell generation):
- L1 (per core): 4 cycles or ~1.3ns latency - 12x 32KB+32KB
- L2 (per core): 12 cycles or ~3.92ns latency - 12x 256KB
- L3 (shared): 34 cycles or ~11.11ns latency - 30MB
- System memory: ~100ns latency - 8x 8GB
Each cache layer is able to store more, but is farther away. It’s a trade-off in processor design with balances in play. For example, more memory per core means (almost certainly) on average putting it farther away on the chip from the core and that has costs in latency, opportunity costs, and power consumption. How far an electric charge has to travel has substantial impact at this scale; remember that distance is multiplied by billions every second.
And I didn’t get into disk latency above because we so very rarely touch disk. Why? Well, I guess to explain that we need to…look at disks. Ooooooooh shiny disks! But please don’t touch them after running around in socks. At Stack Overflow, anything production that’s not a backup or logging server is on SSDs. Local storage generally falls into a few tiers for us:
These numbers are changing all the time, so don’t focus on exact figures too much. What we’re trying to evaluate is the magnitude of the difference of these storage tiers. Let’s go down the list (assuming the lower bound of each, these are best case numbers):
- L1: 1.3ns
- L2: 3.92ns (3x slower)
- L3: 11.11ns (8.5x slower)
- DDR4 RAM: 100ns (77x slower)
- NVMe SSD: 120,000ns (92,307x slower)
- SATA/SAS SSD: 400,000ns (307,692x slower)
- Rotational HDD: 2–6ms (1,538,461x slower)
- Microsoft Live Login: 12 redirects and 5s (3,846,153,846x slower, approximately)
If numbers aren’t your thing, here’s a neat open source visualization (use the slider!) by Colin Scott (you can even go see how they’ve evolved over time – really neat):

With those performance numbers and a sense of scale in mind, let’s add some numbers that matter every day. Let’s say our data source is X, where what X is doesn’t matter. It could be SQL, or a microservice, or a macroservice, or a leftpad service, or Redis, or a file on disk, etc. The key here is that we’re comparing that source’s performance to that of RAM. Let’s say our source takes…
- 100ns (from RAM - fast!)
- 1ms (10,000x slower)
- 100ms (100,000x slower)
- 1s (1,000,000x slower)
I don’t think we need to go further to illustrate the point: even things that take only 1 millisecond are way, *way* slower than local RAM. Remember: millisecond, microsecond, nanosecond – just in case anyone else forgets that a 1000ns != 1ms like I sometimes do…
But not all cache is local. For example, we use Redis for shared caching behind our web tier (which we’ll cover in a bit). Let’s say we’re going across our network to get it. For us, that’s a 0.17ms roundtrip and you need to also send some data. For small things (our usual), that’s going to be around 0.2–0.5ms total. Still 2,000–5,000x slower than local RAM, but also a lot faster than most sources. Remember, these numbers are because we’re in a small local LAN. Cloud latency will generally be higher, so measure to see your latency.
When we get the data, maybe we also want to massage it in some way. Probably Swedish. Maybe we need totals, maybe we need to filter, maybe we need to encode it, maybe we need to fudge with it randomly just to trick you. That was a test to see if you’re still reading. You passed! Whatever the reason, the commonality is generally we want to do <x> once, and not every time we serve it.
Sometimes we’re saving latency and sometimes we’re saving CPU. One or both of those are generally why a cache is introduced. Now let’s cover the flip side…
Why Wouldn’t We Cache?
For everyone who hates caching, this is the section for you! Yes, I’m totally playing both sides.
Given the above and how drastic the wins are, why wouldn’t we cache something? Well, because *every single decision has trade-offs*. Every. Single. One. It could be as simple as time spent or opportunity cost, but there’s still a trade-off.
When it comes to caching, adding a cache comes with some costs:
- Purging values if and when needed (cache invalidation – we’ll cover that in a few)
- Memory used by the cache
- Latency of access to the cache (weighed against access to the source)
- Additional time and mental overhead spent debugging something more complicated
Whenever a candidate for caching comes up (usually with a new feature), we need to evaluate these things…and that’s not always an easy thing to do. Although caching is an exact science, much like astrology, it’s still tricky.
Here at Stack Overflow, our architecture has one overarching theme: keep it as simple as possible. Simple is easy to evaluate, reason about, debug, and change if needed. Only make it more complicated if and when it *needs* to be more complicated. That includes cache. Only cache if you need to. It adds more work and more chances for bugs, so unless it’s needed: don’t. At least, not yet.
Let’s start by asking some questions.
- Is it that much faster to hit cache?
- What are we saving?
- Is it worth the storage?
- Is it worth the cleanup of said storage (e.g. garbage collection)?
- Will it go on the large object heap immediately?
- How often do we have to invalidate it?
- How many hits per cache entry do we think we’ll get?
- Will it interact with other things that complicate invalidation?
- How many variants will there be?
- Do we have to allocate just to calculate the key?
- Is it a local or remote cache?
- Is it shared between users?
- Is it shared between sites?
- Does it rely on quantum entanglement or does debugging it just make you think that?
- What color is the cache?
All of these are questions that come up and affect caching decisions. I’ll try and cover them through this post.
Layers of Cache at Stack Overflow
We have our own “L1”/”L2” caches here at Stack Overflow, but I’ll refrain from referring to them that way to avoid confusion with the CPU caches mentioned above. What we have is several types of cache. Let’s first quickly cover local and memory caches here for terminology before a deep dive into the common bits used by them:
-
- “Global Cache”
-
In-memory cache (global, per web server, and backed by Redis on miss)
- Usually things like a user’s top bar counts, shared across the network
- This hits local memory (shared keyspace), and then Redis (shared keyspace, using Redis database 0)
-
- “Site Cache”
-
In-memory cache (per site, per web server, and backed by Redis on miss)
- Usually things like question lists or user lists that are per-site
- This hits local memory (per-site keyspace, using prefixing), and then Redis (per-site keyspace, using Redis databases)
-
- “Local Cache”
-
In-memory cache (per site, per web server, backed by
nothing
)
- Usually things that are cheap to fetch, but huge to stream and the Redis hop isn’t worth it
- This hits local memory only (per-site keyspace, using prefixing)
What do we mean by “per-site”? Stack Overflow and the Stack Exchange network of sites is a multi-tenant architecture. Stack Overflow is just one of many hundreds of sites. This means one process on the web server hosts all the sites, so we need to split up the caching where needed. And we’ll have to purge it (we’ll cover how that works too).
Redis
Before we discuss how servers and shared cache work, let’s quickly cover what the shared bits are built on: Redis. So what is Redis? It’s an open source key/value data store with many useful data structures, additional publish/subscriber mechanisms, and rock solid stability.
Why Redis and not <something else>? Well, because it works. And it works well. It seemed like a good idea when we needed a shared cache. It’s been incredibly rock solid. We don’t wait on it – it’s incredibly fast. We know how it works. We’re very familiar with it. We know how to monitor it. We know how to spell it. We maintain one of the most used open source libraries for it. We can tweak that library if we need.
It’s a piece of infrastructure we just don’t worry about. We basically take it for granted (though we still have an HA setup of replicas – we’re not completely crazy). When making infrastructure choices, you don’t just change things for perceived possible value. Changing takes effort, takes time, and involves risk. If what you have works well and does what you need, why invest that time and effort and take a risk? Well…you don’t. There are thousands of better things you can do with your time. Like debating which cache server is best!
We have a few Redis instances to separate concerns of apps (but on the same set of servers), here’s an example of what one looks like:

For the curious, some quick stats from last Tuesday (2019-07-30) This is across all instances on the primary boxes (because we split them up for organization, not performance…one instance could handle everything we do quite easily):
- Our Redis physical servers have 256GB of memory, but less than 96GB used.
- 1,586,553,473 commands processed per day (3,726,580,897 commands and 86,982 per second peak across all instances – due to replicas)
- Average of 2.01% CPU utilization (3.04% peak) for the entire server (< 1% even for the most active instance)
- 124,415,398 active keys (422,818,481 including replicas)
- Those numbers are across 308,065,226 HTTP hits (64,717,337 of which were question pages)
Note: None of these are Redis limited – we’re far from any limits. It’s just how much activity there is on our instances.
There are also non-cache reasons we use Redis, namely: we also use the pub/sub mechanism for our websockets that provide realtime updates on scores, rep, etc. Redis 5.0 added Streams which is a perfect fit for our websockets and we’ll likely migrate to them when some other infrastructure pieces are in place (mainly limited by Stack Overflow Enterprise’s version at the moment).
In-Memory & Redis Cache
Each of the above has an in-memory cache component and some have a backup in that lovely Redis server.
In-memory is simple enough, we’re just caching things in…ya know, memory. In ASP.NET MVC 5, this used to be HttpRuntime.Cache. These days, in preparation for our ASP.NET Core move, we’ve moved on to MemoryCache. The differences are tiny and don’t matter much; both generally provide a way to cache an object for some duration of time. That’s all we need here.
For the above caches, we choose a “database ID”. These relate to the sites we have on the Stack Exchange Network and come from our Sites database table. Stack Overflow is 1, Server Fault is 2, Super User is 3, etc.
For local cache, you could approach it a few ways. Ours is simple: that ID is part of the cache key. For Global Cache (shared), the ID is zero. We further (for safety) prefix each cache to avoid conflicts with general key names from whatever else might be in these app-level caches. An example key would be:
prod:1-related-questions:1234
That would be the related questions in the sidebar for Question 1234 on Stack Overflow (ID: 1). If we’re only in-memory, serialization doesn’t matter and we can just cache any object. However, if we’re sending that cache object somewhere (or getting one back from somewhere), we need to serialize it. And fast! That’s where protobuf-net written by our own Marc Gravell comes in. Protobuf is a binary encoding format that’s tremendously efficient in both speed and allocations. A simple object we want to cache may look like this:
public class RelatedQuestionsCache
{
    public int Count { get; set; }
    public string Html { get; set; }
}
With protobuf attributes to control serialization, it looks like this:
[ProtoContract]
public class RelatedQuestionsCache
{
    [ProtoMember(1)] public int Count { get; set; }
    [ProtoMember(2)] public string Html { get; set; }
}
So let’s say we want to cache that object in Site Cache. The flow looks like this (code simplified a bit):
public T Get<T>(string key)
{
    // Transform to the shared cache key format, e.g. "x" into "prod:1-x"
    var cacheKey = GetCacheKey(key);
    // Do we have it in memory?
    var local = memoryCache.Get<RedisWrapper>(cacheKey);
    if (local != null)
    {
        // We've got it local - nothing more to do.
        return local.GetValue<T>();
    }
    // Is Redis connected and readable? This makes Redis a fallback and not critical
    if (redisCache.CanRead(cacheKey)) // Key is passed here for the case of Redis Cluster
    {
    	var remote = redisCache.StringGetWithExpiry(cacheKey)
        if (remote.Value != null)
        {
            // Get our shared construct for caching
       	    var wrapper = RedisWrapper.From(remote);
            // Set it in our local memory cache so the next hit gets it faster
            memoryCache.Set<RedisWrapper>(key, wrapper, remote.Expiry);
            // Return the value we found in Redis
            return remote.Value;
        }
    }
    // No value found, sad panda
    return null;
}
Granted, this code is greatly simplified to convey the point, but we’re not leaving anything important out.
Why a RedisWrapper<T>? It synonymizes platform concepts by having a value with a TTL (time-to-live) with the value, just like Redis does. It also allows the caching of a null value and makes that handling not special-cased. In other words, you can tell the difference between “It’s not cached” and “We looked it up. It was null. We cached that null. STOP ASKING!” If you’re curious about StringGetWithExpiry, it’s a StackExchange.Redis method that returns the value and the TTL in one call by pipelining the commands (not 2 round-trip time costs).
A Set<T> for caching a value works exactly the same way:
- Cache the value in memory.
- Cache the same value in Redis.
- (Optionally) Alert the other web servers that the value has been updated and instruct them to flush their copy.
Pipelining
I want to take a moment and relay a very important thing here: our Redis connections (via StackExchange.Redis) are pipelined. Think of it like a conveyor belt you can stick something on and it goes somewhere and circles back. You could stick thousands of things in a row on that conveyor belt before the first reaches the destination or comes back. If you put a giant thing on there, it means you have to wait to add other things.
The items may be independent, but the conveyor belt is shared. In our case, the conveyor belt is the connection and the items are commands. If a large payload goes on or comes back, it occupies the belt for a bit. This means if you’re waiting on a specific thing but some nasty big item clogs up he works for a second or two, it may cause collateral damage. That’s a timeout.
We often see issues filed from people putting tremendous many-megabyte payloads into Redis with low timeouts, but that doesn’t work unless the pipe is very, very fast. They don’t see the many-megabyte command timing out…they usually see things waiting behind it timing out.
It’s important to realize that a pipeline is just like any pipe outside a computer. Whatever its narrowest constraint is, that’s where it’ll bottleneck. Except this is a dynamic pipe, more like a hose that can expand or bend or kink. The bottlenecks are not 100% constant. In practical terms, this can be thread pool exhaustion (either feeding commands in or handling them coming out). Or it may be network bandwidth. And maybe something else is using that network bandwidth impacting us.
Remember that at these levels of latency, viewing things at 1Gb/s or 10Gb/s isn’t really using the correct unit of time. For me, it helps to not think in terms of 1Gb/s, but instead in terms of 1Mb/ms. If we’re traversing the network in about a millisecond or less, that payload really does matter and can increase the time taken by very measurable and impactful amounts. That’s all to say: think small here. The limits on any system when you’re dealing with short durations must be considered with relative constraints proportional to the same durations. When we’re talking about milliseconds, the fact that we think of most computing concepts only down to the second is often a factor that confuses thinking and discussion.
Pipelining: Retries
The pipelined nature is also why we can’t retry commands with any confidence. In this sad world our conveyor belt has turned into the airport baggage pickup loopy thingamajig (also in the dictionary, for the record) we all know and love.
You put an bag on the thingamajig. The bag contains something important, probably some really fancy pants. They’re going to someone who you wanted to impress. (We’re using airport luggage as a very reasonably priced alternative to UPS in this scenario.) But Mr. Fancy Pants is super nice and promised to return your bag. So nice. You did your part. The bag went on the thingamajig and went out of sight…and never make it back. Okay…where did it go?!? We don’t know! DAMN YOU BAG!
Maybe the bag made it to the lovely person and got lost on the return trip. Or maybe it didn’t. We still don’t know! Should we send it again? What if we’re sending them a second pair of fancy pants? Will they think we think they spill ketchup a lot? That’d be weird. We don’t want to come on too strong. And now we’re just confused and bagless. So let’s talk about something that makes even less sense: cache invalidation.
Cache Invalidation
I keep referring to purging above, so how’s that work? Redis has a pub/sub feature where you can push a message out and subscribers all receive it (this message goes to all replicas as well). Using this simple concept, we can simply have a cache clearing channel we SUBSCRIBE to. When we want to remove a value early (rather than waiting for TTLs to fall out naturally), we just PUBLISH that key name to our channel and the listener (think event handler here) just purges the key from local cache.
The steps are:
- Purge the value from Redis via
DELorUNLINK. Or, just replace the value with a new one…whatever state we’re after. - Broadcast the key to the purge channel.
Order is important, because reversing these would create a race and end up in a re-fetch of the old value sometimes. Note that we’re not pushing the new value out. That’s not the goal. Maybe web servers 1–5 that had the value cache won’t even ask for it again this duration…so let’s not be over-eager and wasteful. All we’re making them do is get it from Redis if and when it’s asked for.
Combining Everything: GetSet
If you look at the above, you’d think we’re doing this a lot:
var val = Current.SiteCache.Get<string>(key);
if (val == null)
{
    val = FetchFromSource();
    Current.SiteCache.Set(key, val, Timespan.FromSeconds(30));
}
return val;
But here’s where we can greatly improve on things. First, it’s repetitive. Ugh. But more importantly, that code will result in hundreds of simultaneous calls to FetchFromSource() at scale when the cache expires. What if that fetch is heavy? Presumably it’s somewhat expensive, since we’ve decided to cache it in the first place. We need a better plan.
This is where our most common approach comes in: GetSet<T>(). Okay, so naming is hard. Let’s just agree everyone has regrets and move on. What do we really want to do here?
- Get a value if it’s there
- Calculate or fetch a value if it’s not there (and shove it in cache)
- Prevent calculating or fetching the same value many times
- Ensure users wait as little as possible
We can use some attributes about who we are and what we do to optimize here. Let’s say you load the web page now, or a second ago, or 3 seconds from now. Does it matter? Is the Stack Overflow question going to change that much? The answer is: only if there’s anything to notice. Maybe you made an upvote, or an edit, or a comment, etc. These are things you’d notice. We must refresh any caches that pertain to those kinds of activities for you. But for any of hundreds of other users simultaneously loading that page, skews in data are imperceptible.
That means we have wiggle room. Let’s exploit that wiggle room for performance.
Here’s what GetSet<T> looks like today (yes, there’s an equivalent-ish async version):
public static T GetSet<T>(
    this ImmediateSiteCache cache,
    string key,
    Func<T, MicroContext, T> lookup,
    int durationSecs,
    int serveStaleDataSecs,
    GetSetFlags flags = GetSetFlags.None,
    Server server = Server.PreferMaster)
The key arguments to this are durationSecs and serveStaleDataSecs. A call often looks something like this (it’s a contrived example for simplicity of discussion):
var lookup = Current.SiteCache.GetSet<Dictionary<int, string>>("User:DisplayNames",
   (old, ctx) => ctx.DB.Query<(int Id, string DisplayName)>("Select Id, DisplayName From Users")
                       .ToDictionary(i => i.Id),
    60, 5*60);
This call goes to the Users table and caches an Id -> DisplayName lookup (we don’t actually do this, I just needed a simple example). The key part is the values at the end. We’re saying “cache for 60 seconds, but serve stale for 5 minutes”.
The behavior is that for 60 seconds, any hits against this cache only return it. But we keep the value in memory (and Redis) for 6 minutes total. In the time between 60 seconds and 6 minutes (from the time cached), we’ll happily still serve the value to users. But, we’ll kick off a background refresh on another thread at the same time so future users get a fresh value. Rinse and repeat.
Another important detail here is we keep a per-server local lock table (a ConcurrentDictionary) that prevents two calls from trying to run that lookup function and getting the value at the same time. For example, there’s no win in querying the database 400 times for 400 users. Users 2 though 400 are better off waiting on the first cache to complete and our database server isn’t kinda sorta murdered in the process. Why a ConcurrentDictionary instead of say a HashSet? Because we want to lock on the object in that dictionary for subsequent callers. They’re all waiting on the same fetch and that object represents our fetch.
If you’re curious about that MicroContext, that goes back to being multi-tenant. Since the fetch may happen on a background thread, we need to know what it was for. Which site? Which database? What was the previous cache value? Those are things we put on the context before passing it to the background thread for the lookup to grab a new value. Passing the old value also lets us handle an error case as desired, e.g. logging the error and still returning the old value, because giving a user slightly out-of-date data is always always better than an error page. We choose per call here though. If returning the old value is bad for some reason – just don’t do that.
Types and Things
A question I often get is how do we use DTOs (data transfer objects)? In short, we don’t. We only use additional types and allocations when we need to. For example, if we can run a .Query<MyType>("Select..."); from Dapper and stick it into cache, we will. There’s little reason to create another type just to cache.
If it makes sense to cache the type that’s 1:1 with a database table (e.g. Post for the Posts table, or User for the Users table), we’ll cache that. If there’s some subtype or combination of things that are the columns from a combined query, we’ll just .Query<T> as that type, populating from those columns, and cache that. If that still sounds abstract, here’s a more concrete example:
[ProtoContract]
public class UserCounts
{
    [ProtoMember(1)] public int UserId { get; }
    [ProtoMember(2)] public int PostCount { get; }
    [ProtoMember(3)] public int CommentCount { get; }
}

public Dictionary<int, UserCounts> GetUserCounts() =>
    Current.SiteCache.GetSet<Dictionary<int, UserCounts>>("All-User-Counts", (old, ctx) =>
    {
        try
        {
            return ctx.DB.Query<UserCounts>(@"
  Select u.Id UserId, PostCount, CommentCount
    From Users u
         Cross Apply (Select Count(*) PostCount From Posts p Where u.Id = p.OwnerUserId) p
         Cross Apply (Select Count(*) CommentCount From PostComments pc Where u.Id = pc.UserId) pc")
                .ToDictionary(r => r.UserId);
        }
        catch(Exception ex)
        {
            Env.LogException(ex);
            return old; // Return the old value
        }
    }, 60, 5*60);
In this example we are taking advantage of Dapper’s built-in column mapping. (Note that it sets get-only properties.) The type used is just for this. For example, it could even be private, and make this method take a int userId with the Dictionary<int, UserCount> being a method-internal detail. We’re also showing how T old and the MicroContext are used here. If an error occurs, we log it and return the previous value.
So…types. Yeah. We do whatever works. Our philosophy is to not create a lot of types unless they’re useful. DTOs generally don’t come with just the type, but also include a lot of mapping code – or more magical code (e.g. reflection) that maps across and is subject to unintentional breaks down the line. Keep. It. Simple. That’s all we’re doing here. Simple also means fewer allocations and instantiations. Performance is often the byproduct of simplicity.
Redis: The Good Types
Redis has a variety of data types. All of the key/value examples thus far use “String” type in Redis. But don’t think of this as a string data type like you’re used to in programming (for example, string in .NET, or in Java). It basically means “some bytes” in the Redis usage. It could be a string, it could be a binary image, or it could be…well, anything you can store in some bytes! But, we use most of the other data types in various ways as well:
- Redis Lists are useful for queues like our aggregator or account actions to execute in-order.
- Redis Sets are useful for unique lists of items like “which account IDs are in this alpha test?” (things that are unique, but not ordered).
- Redis Hashes are useful for things that are dictionary-like, such as “What’s the latest activity date for a site?” (where the hash key ID is site and the value is a date). We use this to determine “Do we need to run badges on site X this time?” and other questions.
- Redis Sorted Sets are useful for ordered things like storing the slowest 100 MiniProfiler traces per route.
Speaking of sorted sets, we need to replace the /users page to be backed by sorted sets (one per reputation time range) with range queries instead. Marc and I planned how to do this at a company meetup in Denver many years ago but keep forgetting to do it…
Monitoring Cache Performance
There are a few things to keep an eye on here. Remember those latency factors above? It’s super slow to go off box. When we’re rendering question pages in an average of 18–20ms, taking ~0.5ms for a Redis call is a lot. A few calls quickly add up to a significant part of our rendering time.
First, we’ll want to keep an eye on this at the page level. For this, we use MiniProfiler to see every Redis call involved in a page load. It’s hooked up with StackExchange.Redis’s profiling API. Here’s an example of what that looks like on a question page, getting my live across-the-network counts for the top bar:

Second, we want to keep an eye on the Redis instances. For that, we use Opserver. Here’s what a single instance looks like:

We have some built-in tools there to analyze key usage and the ability to group them by regex pattern. This lets us combine what we know (we’re the ones caching!) with the data to see what’s eating the most space.
Note: Running such an analysis should only be done on a secondary. It’s very abusive on a master at scale. Opserver will by default run such analysis on a replica and block running it on a master without an override.
What’s Next?
.NET Core is well underway here at Stack. We’ve ported most support services and are working on the main applications now. There’s honestly not a lot of cache to the caching layer, but one interesting possibility is Utf8String (which hasn’t landed yet). We cache a lot of stuff in total, lots of tiny strings in various places – things like “Related Questions” in the sidebar. If those cache entries were UTF8 instead of the .NET default of UTF16, they’d be half the size. When you’re dealing with hundreds of thousands of strings at any given time, it adds up.
Story Time
I asked what people wanted to know about caching on Twitter and how failures happen came up a lot. For fun, let’s recall a few that stand out in my mind:
Taking Redis Down While Trying to Save It
At one point, our Redis primary cache was getting to be about 70GB total. This was on 96GB servers. When we saw the growth over time, we planned a server upgrade and transition. By the time we got hardware in place and were ready to failover to a new master server, we had reached about 90GB of cache usage. Phew, close. But we made it!
…or not. I was travelling for this one, but helped planned it all out. What we didn’t account for was the memory fork that happens for a BGSAVE in Redis (at least in that version – this was back in 2.x). We were all very relieved to have made preparations in time, so on a weekend we hit the button and fired up data replication to the new server to prepare a failover to it.
And all of our websites promptly went offline.
What happens in the memory fork is that data that’s changed during the migration gets shadow copied, something that isn’t released until the clone finishes…because we need the state the server was at to initialize along with all changes since then to replicate to the new node (else we lose those new changes). So the rate at which new changes rack up is your memory growth during a copy. That 6GB went fast. Really fast. Then Redis crashed, the web servers went without Redis (something they hadn’t done in years), and they really didn’t handle it well.
So I pulled over on the side of the road, hopped on our team call, and we got the sites back up…against the new server and an empty cache. It’s important to note that Redis didn’t do anything wrong, we did. And Redis has been rock solid for a decade here. It’s one of the most stable pieces of infrastructure we have…you just don’t think about it.
But anyway, another lesson learned.
Accidentally Not Using Local Cache
A certain developer we have here will be reading this and cursing my name, but I love you guys and gals so let’s share anyway!
When we get a cache value back from Redis in our local/remote 2-layer cache story, we actually send two commands: a fetch of the key and a TTL. The result of the TTL tells us how many seconds Redis is caching it for…that’s how long we also cache it in local server memory. We used to use a -1 sentinel value for TTL through some library code to indicate something didn’t have a TTL. The semantics changed in a refactor to null for “no TTL”…and we got some boolean logic wrong. Oops. A rather simple statement like this from our Get<T> mentioned earlier:
if (ttl != -1) // ... push into L1
Became:
if (ttl == null) // ... push into L1
But most of our caches DO have a TTL. This meant the vast majority of keys (probably something like 95% or more) were no longer caching in L1 (local server memory). Every single call to any of these keys was going to Redis and back. Redis was so resilient and fast, we didn’t notice for a few hours. The actual logic was then corrected to:
if (ttl != null) // ... push into L1
…and everyone lived happily ever after.
Accidentally Caching Pages For .000006 Seconds
You read that right.
Back in 2011, we found a bit of code in our page-level output caching when looking into something unrelated:
.Duration = new TimeSpan(60);
This was intended to cache a thing for a minute. Which would have worked great if the default constructor for TimeSpan was seconds and not ticks. But! We were excited to find this. How could cache be broken? But hey, good news – wow we’re going to get such a performance boost by fixing this!
Nope. Not even a little. All we saw was memory usage increase a tiny bit. CPU usage also went up.
For fun: this was included at the end of in an interview back at MIX 2011 with Scott Hanselman. Wow. We looked so much younger then. Anyway, that leads us to…
Doing More Harm Than Good
For many years, we used to output cache major pages. This included the homepage, question list pages, question pages themselves, and RSS feeds.
Remember earlier: when you cache, you need to vary the cache keys based on the variants of cache. Concretely, this means: anonymous, or not? mobile, or not? deflate, gzip, or no compression? Realistically, we can’t (or shouldn’t) ever output cache for logged-in users. Your stats are in the top bar and it’s per-user. You’d notice your rep was inconsistent between page views and such.
Anyway, when you step back and combine these variants with the fact that about 80% of all questions are visited every two weeks, you realize that the cache hit rate is low. Really low. But the cost of memory to store those strings (most large enough to go directly on the large object heap) is very non-trivial. And the cost of the garbage collector cleaning them up is also non-trivial.
It turns out those two pieces of the equation are so non-trivial that caching did far more harm than good. The savings we got from the relatively occasional cache hit were drastically outweighed by the cost of having and cleaning up the cache. This puzzled us a bit at first, but when you zoom out and look at the numbers, it makes perfect sense.
For the past several years, Stack Overflow (and all Q&A sites) output cache nothing. Output caching is also not present in ASP.NET Core, so phew on not using it.
Full disclosure: we still cache full XML response strings (similar to, but not using output cache) specifically on some RSS feed routes. We do so because the hit rate is quite high on these routes. This specific cache has all of the downsides mentioned above, except it’s well worth it on the hit ratios.
Figuring Out That The World Is Crazier Than You Are
When .NET 4.6.0 came out, we found a bug. I was digging into why MiniProfiler didn’t show up on the first page load locally, slowly went insane, and then grabbed Marc Gravell to go descend into madness with me.
The bug happened in our cache layer due to the nature of the issue and how it specifically affected only tail calls. You can read about how it manifested here, but the general problem is: methods weren’t called with the parameters you passed in. Ouch. This resulted in random cache durations for us and was pretty scary when you think about it. Luckily the problem with the RyuJIT was hotfixed the following month.
.NET 4.6.2 Caching Responses for 2,017 years
Okay this one isn’t server-side caching at all, but I’m throwing it in because it was super “fun”. Shortly after deploying .NET 4.6.2, we noticed some oddities with client cache behavior, CDN caches growing, and other crazy. It turns out, there was a bug in .NET 4.6.2.
The cause was simple enough: when comparing the DateTime values of “now” vs. when a response cache should expire and calculating the difference between those to figure out the max-age portion of the Cache-Control header, the value was subtly reset to 0 on the “now” side. So let’s say:
2017-04-05 01:17:01 (cache until) - 2017-04-05 01:16:01 (now) = 60 seconds
Now, let’s say that “now” value was instead 0001-01-01 00:00:00…
2017-04-05 01:17:01 (cache until) - 0001-01-01 00:00:00 (now) = 63,626,951,821 seconds
Luckily the math is super easy. We’re telling a browser to cache that value for 2017 years, 4 months, 5 days, 1 hour, 17 minutes and 1 second. Which might be a tad bit of overkill. Or on CDNs, we’re telling CDNs to cache things for that long…also problematic.

Well crap. We didn’t realize this early enough. (Would you have checked for this? Are we idiots?) So that was in production and a rollback was not a quick solution. So what do we do?
Luckily, we had moved to Fastly at this point, which uses Varnish & VCL. So we can just hop in there and detect these crazy max-age values and override them to something sane. Unless, of course, you screw that up. Yep. Turns out on first push we missed a critical piece of the normal hash algorithm for cache keys on Fastly and did things like render people’s flair back when you tried to load a question. This was corrected in a few minutes, but still: oops. Sorry about that. I reviewed and okayed that code to go out personally.
When It’s Sorta Redis But Not
One issue we had was the host itself interrupting Redis and having perceptible pipeline timeouts. We looked in Redis: the slowness was random. The commands doing it didn’t form any pattern or make any sense (e.g. tiny keys). We looked at the network and packet traces from both the client and server looked clean – the pause was inside the Redis host based on the correlated timings.
Okay so…what is it? Turns out after a lot of manual profiling and troubleshooting, we found another process on the host that spiked at the same time. It was a small spike we thought nothing of at first, but how it spiked was important.
It turns out that a monitoring process (dammit!) was kicking off vmstat to get memory statistics. Not that often, not that abusive – it was actually pretty reasonable. But what vmstat did was punt Redis off of the CPU core it was running on. Like a jerk. Sometimes. Randomly. Which Redis instance? Well, that depends on the order they started in. So yeah…this bug seemed to hop around. The changing of context to another core was enough to see timeouts with how often we were hitting Redis with a constant pipe.
Once we found this and factored in that we have plenty of cores in these boxes, we began pinning Redis to specific cores on the physical hosts. This ensures the primary function of the servers always has priority and monitoring is secondary.
Since writing this and asking for reviews, I learned that Redis now has built-in latency monitoring which was added shortly after the earlier 2.8 version we were using at the time. Check out LATENCY DOCTOR especially. AWESOME. Thank you Salvatore Sanfilippo! He’s the lovely @antirez, author of Redis.
Now I need to go put the LATENCY bits into StackExchange.Redis and Opserver…
Caching FAQ
I also often get a lot of questions that don’t really fit so well above, but I wanted to cover them for the curious. And since you know we love Q&A up in here, let’s try a new section in these posts that I can easily add to as new questions come up.
Q: Why don’t you use Redis Cluster? A: There are a few reasons here:
- We use databases, which aren’t a feature in Cluster (to minimize the message replication header size). We can get around this by moving the database ID into the cache key instead (as we do with local cache above). But, one giant database has maintainability trade-offs, like when you go to figure out which keys are using so much room.
- The replication topology thus far has been node to node, meaning maintenance on the master cluster would require shifting the same topology on a secondary cluster in our DR data center. This would make maintenance harder instead of easier. We’re waiting for cluster <-> cluster replication, rather than node <-> node replication there.
- It would require 3+ nodes to run correctly (due to elections and such). We currently only run 2 physical Redis servers per data center. Just 1 server is way more performance than we need, and the second is a replica/backup.
Q: Why don’t you use Redis Sentinel? A: We looked into this, but the overall management of it wasn’t any simpler than we had today. The idea of connecting to an endpoint and being directed over is great, but the management is complicated enough that it’s not worth changing our current strategy given how incredibly stable Redis is. One of the biggest issues with Sentinel is the writing of the current topology state into the same config file. This makes it very unfriendly to anyone with managed configs. For example, we use Puppet here and the file changes would fight with it every run.
Q: How do you secure Stack Overflow for Teams cache? A: We maintain an isolated network and separate Redis servers for private data. Stack Overflow Enterprise customers each have their own isolated network and Redis instances as well.
Q: What if Redis goes down?!?1!eleven A: First, there’s a backup in the data center. But let’s assume that fails too! Who doesn’t love a good apocalypse? Without Redis at all, we’d limp a bit when restarting the apps. The cold cache would hurt a bit, smack SQL Server around a little, but we’d get back up. You’d want to build slowly if Redis was down (or just hold off on building in general in this scenario). As for the data, we would lose very little. We have treated Redis as optional for local development since before the days it was an infrastructure component at all, and it remains optional today. This means it’s not the source of truth for anything. All cache data it contains could be re-populated from whatever the source is. That leaves us only with active queues. The queues in Redis are account merge type actions (executed sub-second – so a short queue), the aggregator (tallying network events into our central database), and some analytics (it’s okay if we lose some A/B test data for a minute). All of these are okay to have a gap on – it’d be minimal loses.
Q: Are there downsides to databases? A: Yes, one that I’m aware of. At a high limit, it can eventually impact performance by measurable amounts. When Redis expires keys, it loops over databases to find and clear those keys – think of it as checking each “namespace”. At a high count, it’s a bigger loop. Since this runs every 100ms, that number being big can impact performance.
Q: Are you going to open source the “L1”/”L2” cache implementation? A: We’ve always wanted to, but a few things have stood in the way:
- It’s very “us”. By that I mean it’s very multi-tenant focused and that’s probably not the best API surface for everyone. This means we really need to sit down and design that API. It’s a set of APIs we’d love to put into our StackExchange.Redis client directly or as another library that uses it.
- There has been an idea to have more core support (e.g. what we use the pub/sub mechanism for) in Redis server itself. That’s coming in Redis version 6, so we can do a lot less custom pub/sub and use more standard things other clients will understand there. The less we write for “just us” or “just our client”, the better it is for everyone.
- Time. I wish we all had more of it. It’s the most precious thing you have – never take it for granted.
Q: With pipelining, how do you handle large Redis payloads?
A: We have a separate connection called “bulky” for this. It has higher timeouts and is much more rarely used. That’s if it should go in Redis. If a worth-of-caching item is large but not particularly expensive to fetch, we may not use Redis and simply use “Local Cache”, fetching it n times for n web servers. Per-user features (since user sessions are sticky to web servers on Q&A) may fit this bill as well.
Q: What happens when someone runs KEYS on production?
A: Tasers, if they’ll let me. Seriously though, since Redis 2.8.0 you should at least use SCAN which doesn’t block Redis for a full key dump – it does so in chunks and lets other commands go through. KEYS can cause a production blockage in a hurry. And by “can”, I mean 100% of the time at our scale.
Q: What happens when someone runs FLUSHALL on production?
A: It’s against policy to comment on future criminal investigations. Redis 6 is adding ACLs though, which will limit the suspect pool.
Q: How do the police investigators figure out what happened in either of the above cases? Or any latency spike?
A: Redis has a nifty feature called SLOWLOG which (by default) logs every command over 10ms in duration. You can adjust this, but everything should be very fast, so that default 10ms is a relative eternity and what we keep it at. When you run SLOWLOG you can see the last n entries (configurable), the command, and the arguments. Opserver will show these on the instance page, making it easy to find the offender. But, it could be network latency or an unrelated CPU spike/theft on the host. (We pin the Redis instances using processor affinity to avoid this.)
Q: Do you use Azure Cache for Redis for Stack Overflow Enterprise? A: Yes, but we may not long-term. It takes a surprisingly long time to provision when creating one for test environments and such. We’re talking dozens of minutes up to an hour here. We’ll likely use containers later, which will help us control the version used across all deployment modes as well.
Q: Do you expect every dev to know all of this to make caching decisions? A: Absolutely not. I had to look up exact values in many places here. My goal is that developers understand a little bit about the layer beneath and relative costs of things – or at least a rough idea of them. That’s why I stress the orders of magnitude here. Those are the units you should be considering for cost/benefit evaluations on where and how you choose to cache. Most people do not run at hundreds of millions of hits a day where the cost multiplier is so high it’ll ruin your day and optimizations decisions are far less important/impactful. Do what works for you. This is what works for us, with some context on “why?” in hopes that it helps you make your decisions.
Tools
I just wanted to provide a handy list of the tools mentioned in the article as well as a few other bits we use to help with caching:
- StackExchange.Redis - Our open source .NET Redis client library.
- Opserver - Our open source dashboard for monitoring, including Redis.
- MiniProfiler - Our open source .NET profiling tool, with which we view Redis commands issued on any page load.
- Dapper - Our open source object relational mapper for any ADO.NET data source.
- protobuf-net - Marc Gravell’s Protocol Buffers library for idiomatic .NET.
What’s next? The way this series works is I blog in order of what the community wants to know about most. I normally go by the Trello board to see what’s next, but we probably have a queue jumper coming up. We’re almost done porting Stack Overflow to .NET Core and we have a lot of stories and tips to share as well as tools we’ve built to make that migration easier. The next time you see a lot of words from me may be the next Trello board item, or it may be .NET Core. If you have questions that you want to see answered in such a post, please put them on the .NET Core card (open to the public) and I’ll be reviewing all of that when I start writing it. Stay tuned, and thanks for following along.